Key Resistance Zones: 23200, 23600, 24000
Key Support Zones: 20800, 20400, 20000
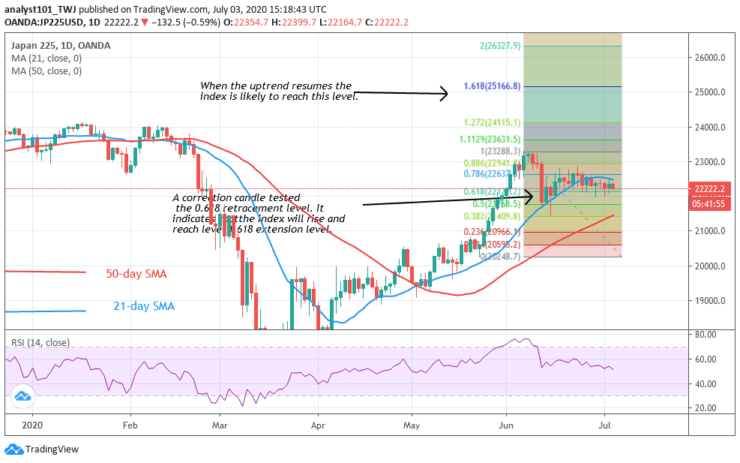
Japan 225 (JP225USD) Long-term Trend: Bullish
Japan 225 is still consolidating above level 22000. A correction candle tested the 0.618 retracement level. It indicates that the index will rise and reach a level 1.618 extension level. Thereafter, the market will continue up trending.
Daily Chart Indicators Reading:
Japan 225 has fallen to level 51 of the Relative Strength Index. The index is an uptrend zone and likely to rise. The market is under bull control. The 21-day SMA and 50-day SMA are sloping upward indicating the uptrend.
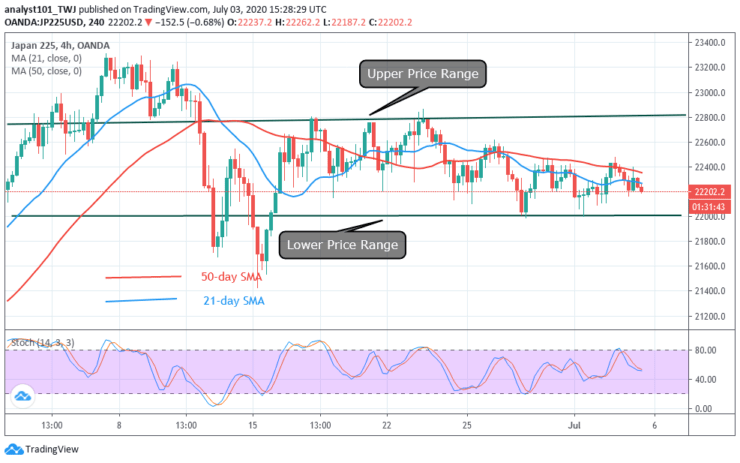
Japan 225 (JP225USD) Medium-term Trend: Ranging
On the 4- hour chart, the index is in a horizontal channel. The market is consolidating between level 22000 and 22800. The market is presently in a tight range between 22000 and 22400.
4-hour Chart Indicators Reading
Japan 225 is below 60 % range of the daily stochastic. This indicates that the price is in a bearish momentum. The 21-day SMA and the 50-day SMA are sloping horizontally indicating the sideways move.
General Outlook for Japan 225 (JP225USD)
Japan 225 is in a sideways move. The index is yet to trend as the price continues to consolidate. After consolidation, the market may trend either way.
Note: Learn2.Trade is not a financial advisor. Do your research before investing your funds in any financial asset or presented product or event. We are not responsible for your investing results
- Broker
- Min Deposit
- Score
- Visit Broker

- Award-winning Cryptocurrency trading platform
- $100 minimum deposit,
- FCA & Cysec regulated

- 20% welcome bonus of upto $10,000
- Minimum deposit $100
- Verify your account before the bonus is credited
- Fund Moneta Markets account with a minimum of $250
- Opt in using the form to claim your 50% deposit bonus
Learn to Trade
Never Miss A Trade Again

Signal Notification
Real-time signal notifications whenever a signal is opened, closes or Updated

Get Alerts
Immediate alerts to your email and mobile phone.

Entry Price Levels
Entry price level for every signal Just choose one of our Top Brokers in the list above to get all this free.