Don’t invest unless you’re prepared to lose all the money you invest. This is a high-risk investment and you are unlikely to be protected if something goes wrong. Take 2 minutes to learn more
It’s not about the coin with the most profit on today’s list of trending coins, but the coin with the fewest losses, such as Helium. As of the time of writing, this token is the second coin with the fewest losses. What’s more, trading indicators suggest that more price reductions may be seen in the market as the day unfolds.
HNT Statistics:
Current Price of Helium: $4.899
HNT’s Market Capitalization: $871.86M
The Circulating Supply of Helium: 176.39M
HNT’s Total Supply: 176.39M
Helium’s CoinMarketCap Rank: 103
Key Price Levels:
Resistance: $5.000, $5.500, $6.000
Support: $4.500, $4.000, $3.500
Helium Downward Correction Advances Past the $5.000 Support
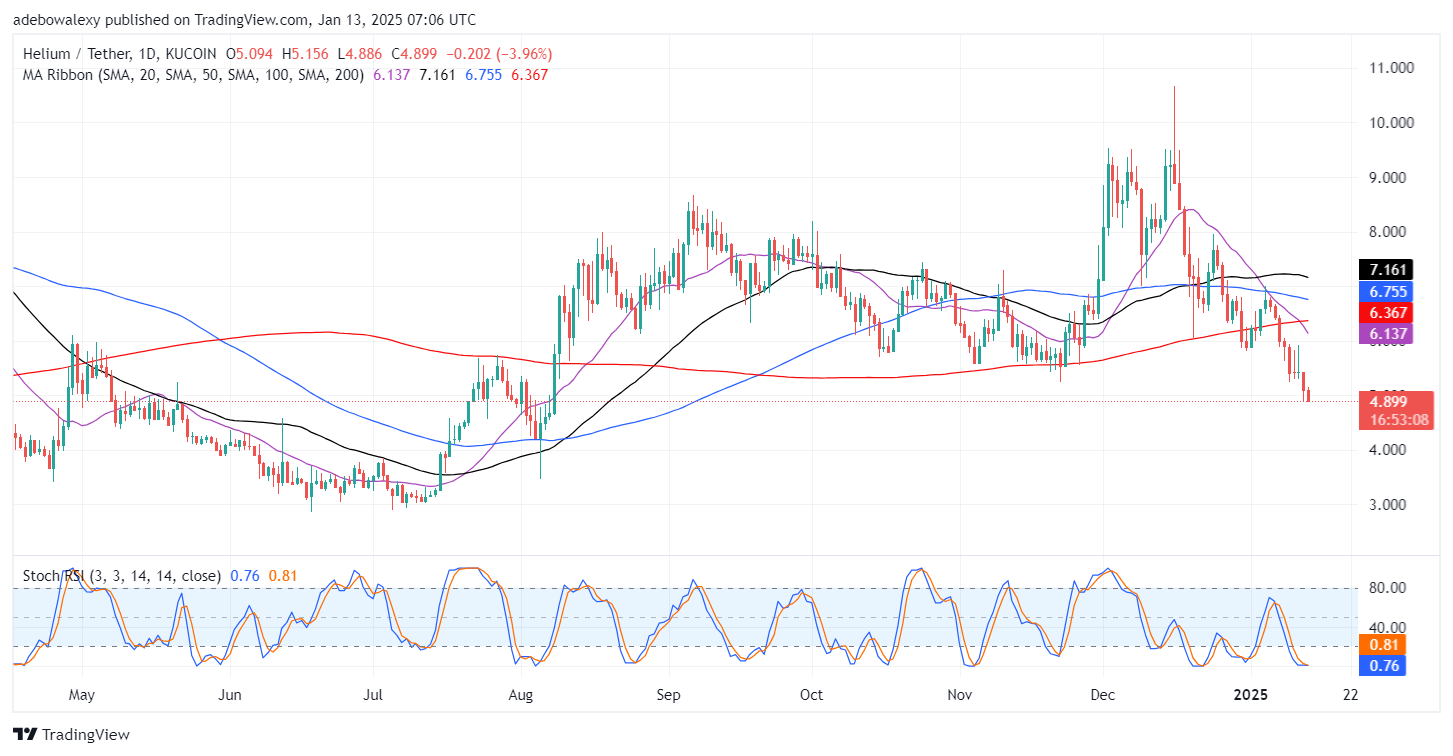
Downward forces have dominated price movement in the HNT market for the past eight sessions. While in the ongoing session, price action has breached the $5.000 baseline. Consequently, price action stays below all the MA Lines on the chart as they continue to cross each other above price activity on the chart.
Likewise, the Stochastic Relative Strength Index (RSI) lines can be seen now at the depth of the oversold. In addition, the lines of this indicator seem to have commenced dragging sideways at the mentioned part of the indicator, suggesting that downward forces are very strong and may push the market lower.
The HNT/USDT Bears Seem at a Brick Wall
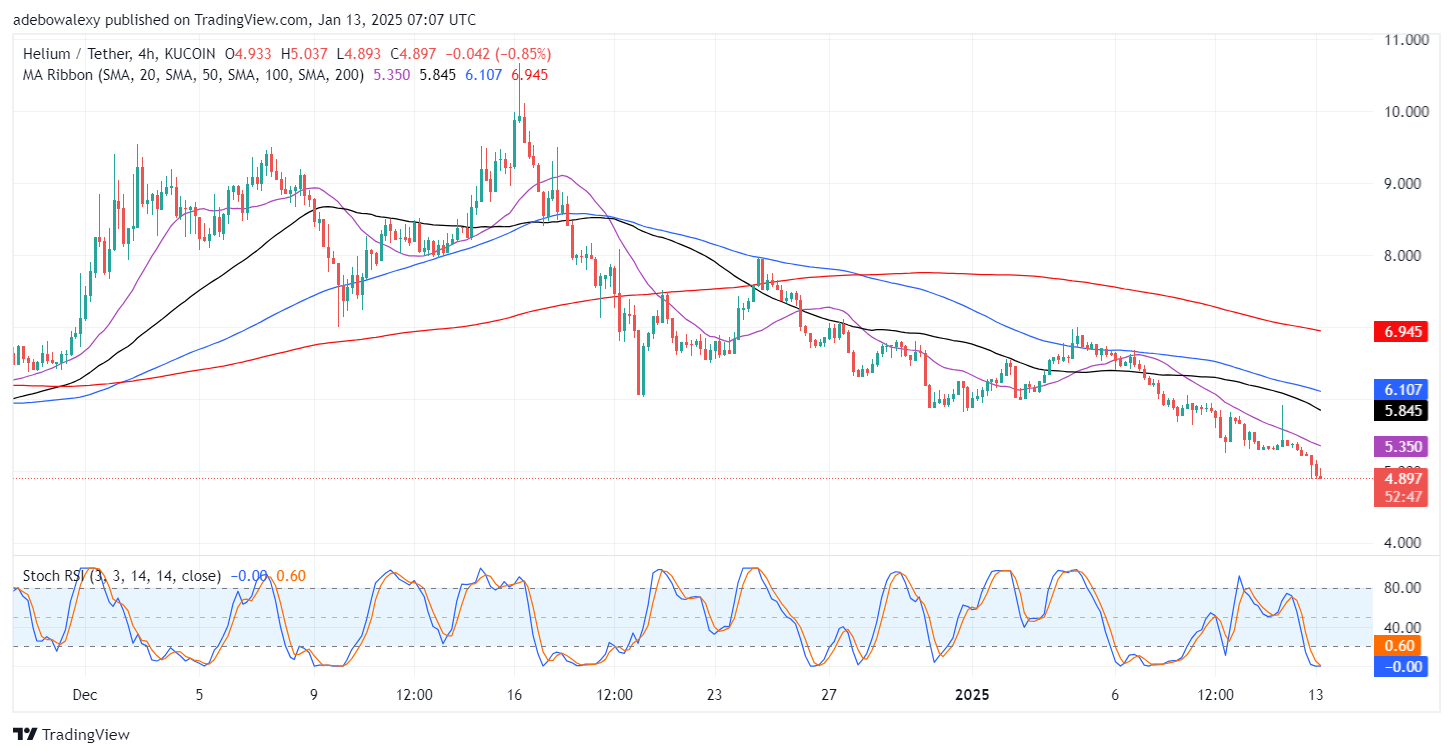
Although Helium’s price action remains bearish and has bearish potential, there are signs that point to the fact that downward forces are only making limited progress. Here, the last price candle stays red and below all the MA lines. Yet it could be seen that the mentioned price candle is compressed downward. This reveals that the market may have hit a bull stronghold.
Meanwhile, the RSI lines have just converged at the 0.00 mark, which may result in a bullish crossover. This will see price action reappear above the $5.000 mark. However, traders might want to wait until the market rises past the 20-day MA line before placing a bullish bet. Otherwise, the price action may continue south with prices falling towards the $4.500 price mark.
Start using a world-class auto trading solution.
- Broker
- Min Deposit
- Score
- Visit Broker
- Award-winning Cryptocurrency trading platform
- $100 minimum deposit,
- FCA & Cysec regulated
- 20% welcome bonus of upto $10,000
- Minimum deposit $100
- Verify your account before the bonus is credited
- Fund Moneta Markets account with a minimum of $250
- Opt in using the form to claim your 50% deposit bonus
Learn to Trade
Never Miss A Trade Again

Signal Notification
Real-time signal notifications whenever a signal is opened, closes or Updated

Get Alerts
Immediate alerts to your email and mobile phone.

Entry Price Levels
Entry price level for every signal Just choose one of our Top Brokers in the list above to get all this free.


