Don’t invest unless you’re prepared to lose all the money you invest. This is a high-risk investment and you are unlikely to be protected if something goes wrong. Take 2 minutes to learn more
Price activity in the Hedera Hashgraph daily market showed that trading activities had recently occurred above the $0.6500 price mark. However, it appears that bulls weren’t able to find a foothold above this price level, which resulted in a downward correction through the $0.6000 price mark. The ongoing session seems to indicate that buyers are preparing to obtain support above the $0.6500 mark.
HBAR Statistics:
Hedera Hashgraph Value Now: $0.6375
Hedera Hashgraph Market Cap: $2,112,547,625
HBAR Circulating Supply: 32,983,824,902
Hedera Hashgraph Total Supply: 50,000,000,000
HBAR CoinMarketCap Ranking: 30
Major Price Levels:
Top: $0.6375, $0.6500, and $0.6600
Base: $0.6300, $0.6200, and $0.6100
 .6500 Threshold" width="580" height="302" data-lazy-src="https://learn2.trade/wp-content/uploads/2023/08/HBARUSDT_2023-08-21_06-11-32-1024x534.png"/>
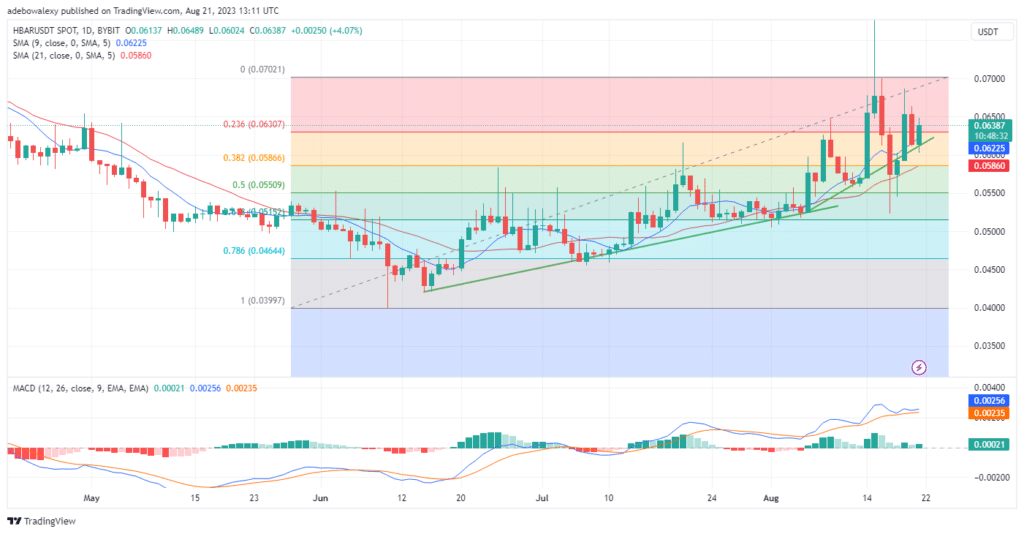
Hedera Hashgraph Price Action Targets the $0.6500 Mark
As earlier mentioned, the Hedera Hashgraph token has recently traded above 0.6500. However, the effect of headwinds has caused the token to lose trading at such a height. But at this point, buyers are now eyeing a retracement towards this mark. The last price candle on this chart has returned price action in this market above the 9- and 21-day Smooth Moving Average (SMA) curves.
Simultaneously, the Moving Average Convergence Divergence (MACD) indicator’s last bar shows that buyers may be increasing their upside momentum as we speak. This could be seen as the mentioned bar is now solid green in appearance. The lines of this indicator also remain above the equilibrium level and seem to be renewing their upside focus.
.6500 Threshold" width="580" height="302" data-lazy-src="https://learn2.trade/wp-content/uploads/2023/08/HBARUSDT_2023-08-21_06-11-53-1024x534.png"/>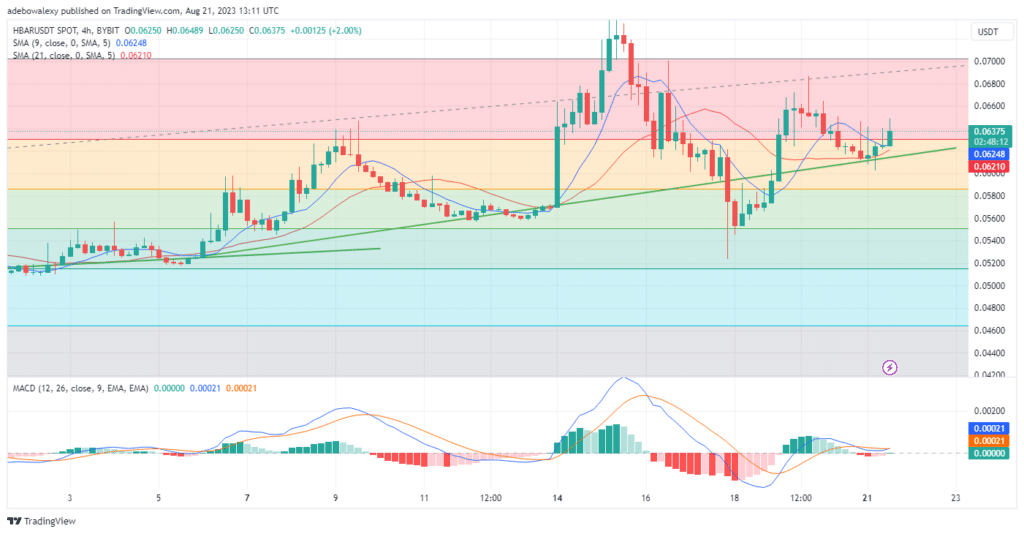
HBAR Price Action May Extend Retracement Beyond the $0.6500 Mark
The HBAR 4-hour market continues to show positive signs about price action advancing through the $0.6500 short-term resistance. The last price candle on this chart could be seen sitting just atop the 9-day SMA curve. Also, considering the appearance of the last price candle, it appears that the bulls are stronger now than in recent trading sessions.
Meanwhile, the MACD indicator lines have now converged for a bullish crossover above the equilibrium level. Consequently, the impending crossover on the MACD indicator and the position of the last price candle on the market chart will deliver considerable upside impetus to price action. As a result, price action may extend the upside retracement towards the $0.6600 price mark.
- Broker
- Min Deposit
- Score
- Visit Broker

- Award-winning Cryptocurrency trading platform
- $100 minimum deposit,
- FCA & Cysec regulated

- 20% welcome bonus of upto $10,000
- Minimum deposit $100
- Verify your account before the bonus is credited
- Fund Moneta Markets account with a minimum of $250
- Opt in using the form to claim your 50% deposit bonus
Learn to Trade
Never Miss A Trade Again

Signal Notification
Real-time signal notifications whenever a signal is opened, closes or Updated

Get Alerts
Immediate alerts to your email and mobile phone.

Entry Price Levels
Entry price level for every signal Just choose one of our Top Brokers in the list above to get all this free.