Don’t invest unless you’re prepared to lose all the money you invest. This is a high-risk investment and you are unlikely to be protected if something goes wrong. Take 2 minutes to learn more
The bulls in the Hedera Hashgraph market have kept on bashing the bears to recover higher prices. Here, it can be seen that prices in this market have increased by a whopping 9.13% in 24 hours. And it appears that buyers are still targeting higher price levels at the moment.
Hedera Hashgraph Statistics:
HBAR Cash Value Now: $0.06052
HBAR Market Cap: $1,981,639,902
Hedera Hashgraph Circulating Supply: 32,559,526,344
HBAR Total Supply: 50,000,000,000
HBAR CoinMarketCap Ranking: 30
Major Price Levels:
Top: $0.06052, $0.06130, and $0.06160
Base: $0.06000, $0.05950, and $0.05900
 .0600 Mark" width="1401" height="730" data-lazy-src="https://learn2.trade/wp-content/uploads/2023/08/HBARUSDT_2023-08-08_11-09-46.png"/>
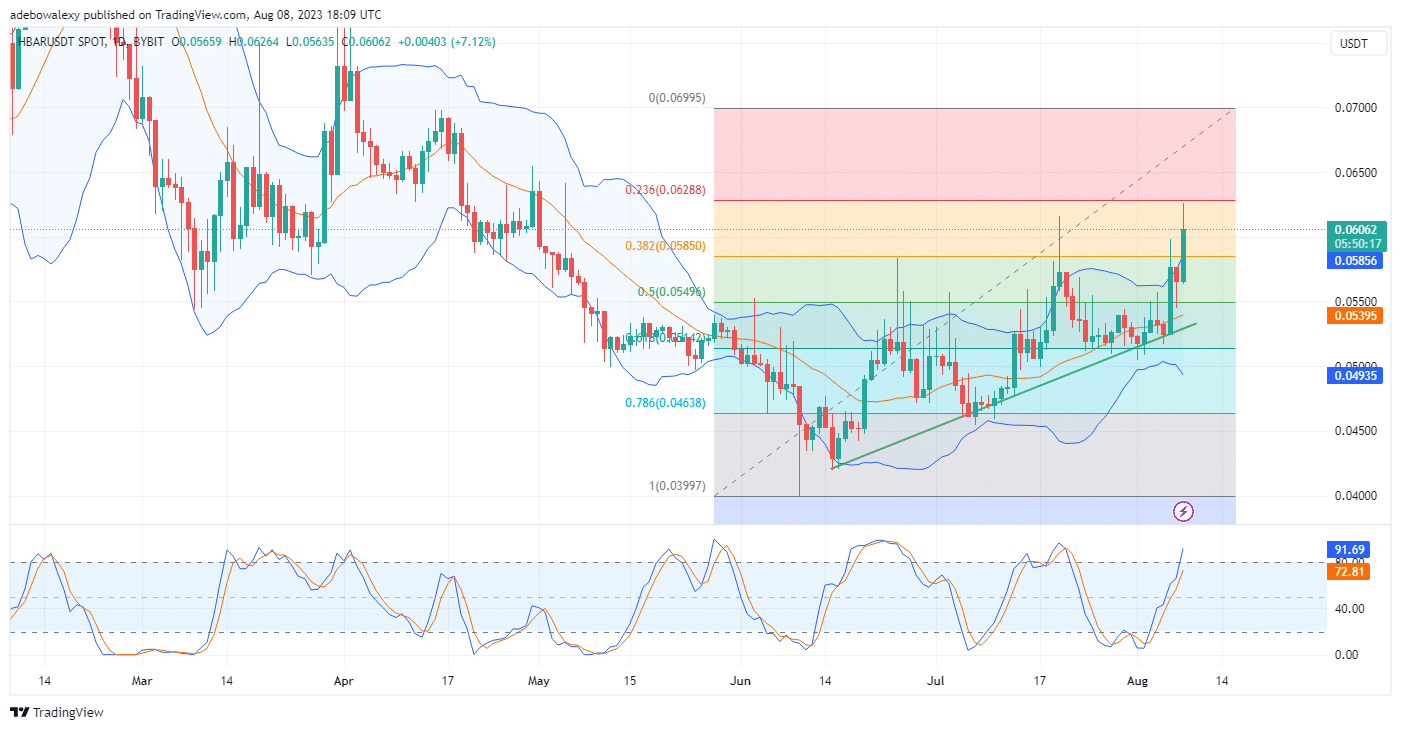
Hedera Hashgraph Bulls Are Maintaining Dominance in the Bear Region
As earlier mentioned, Hedera Hashgraph’s price has ramped up significantly and seems to communicate that buyers are dominating the market at this point. Earlier this month, price action seemed to have rebounded off the trendline drawn on this chart. Since then, price action has kept on retracing higher levels. Currently, price action has broken above the 38.20 Fibonacci Retracement level, bringing prices to settle around an earlier predicted resistance mark of $0.06070.
Meanwhile, the Stochastic Relative Strength Index (RSI) indicator lines keep on rising towards the overbought region. And this is hinting that buyers may march onward to higher price marks in this market.
.0600 Mark" width="1401" height="730" data-lazy-src="https://learn2.trade/wp-content/uploads/2023/08/HBARUSDT_2023-08-08_11-10-12.png"/>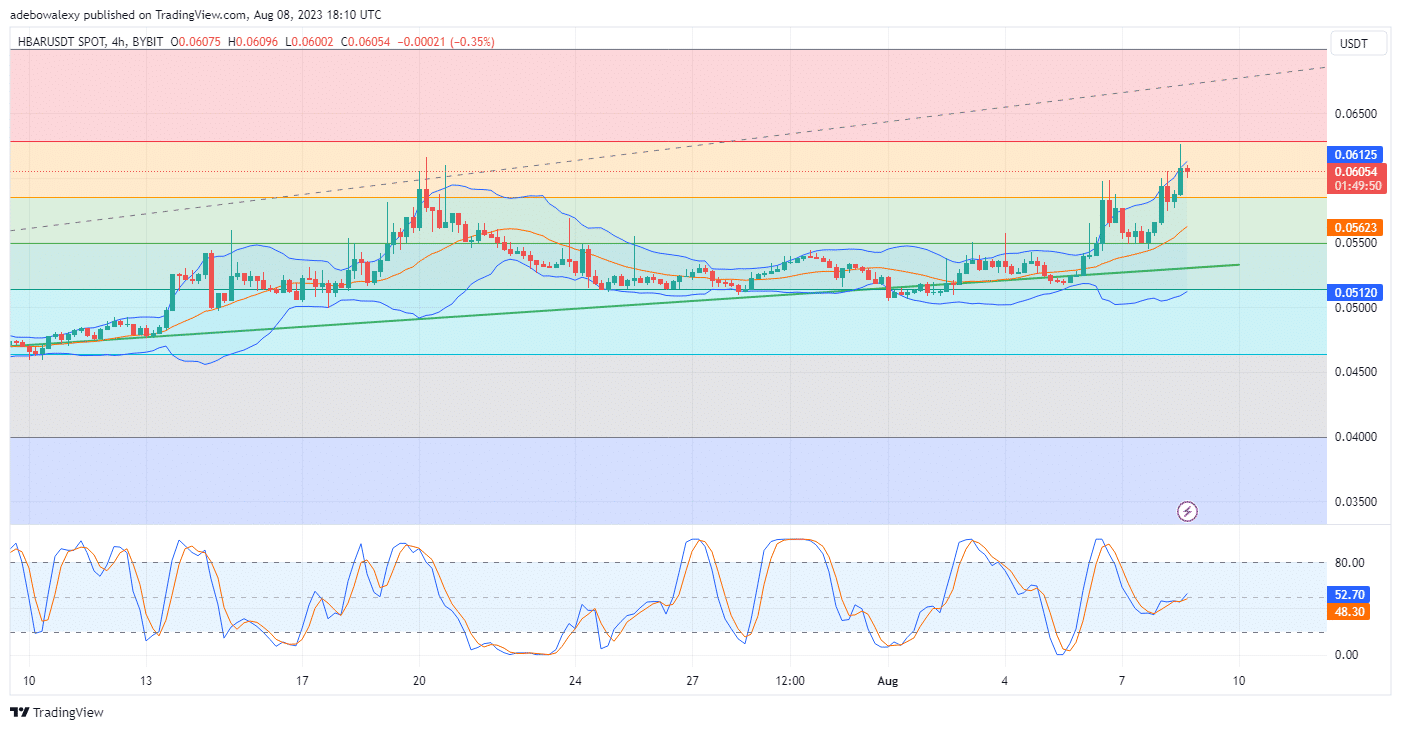
HBAR Is Facing Resistance Between the 38.20 and 23.60 Fibonacci Retracement Levels
Although price action even in the HBAR 4-hour market has largely continued on the upside path, headwinds seem to be having some minor influence. The previous trading session saw prices push the highest limit of the Bollinger Bands Upwards. Subsequently, minor corrections have resulted. However, price action stays largely above the middle band of the Bollinger Bands indicator.
Additionally, the RSI lines keep rising upwards following a recent crossover near the 50 mark of the indicator. Summing up all signs coming from Technical Indicators, we can conclude that buyers are more favorably favored in this mark, and more profit may be recorded towards the $0.06150 mark.
- Broker
- Min Deposit
- Score
- Visit Broker

- Award-winning Cryptocurrency trading platform
- $100 minimum deposit,
- FCA & Cysec regulated

- 20% welcome bonus of upto $10,000
- Minimum deposit $100
- Verify your account before the bonus is credited
- Fund Moneta Markets account with a minimum of $250
- Opt in using the form to claim your 50% deposit bonus
Learn to Trade
Never Miss A Trade Again

Signal Notification
Real-time signal notifications whenever a signal is opened, closes or Updated

Get Alerts
Immediate alerts to your email and mobile phone.

Entry Price Levels
Entry price level for every signal Just choose one of our Top Brokers in the list above to get all this free.