Don’t invest unless you’re prepared to lose all the money you invest. This is a high-risk investment and you are unlikely to be protected if something goes wrong. Take 2 minutes to learn more
Price action in the Hedera Hashgraph daily market has indicated an upward trajectory since October 20th. It has steadily trended upward and currently appears poised to reach its highest price point since August of this year.
Key Hedera Hashgraph Statistics:
Current HBAR Value: $0.06565
HBAR Market Cap: $2,223,752,182
Circulating Supply of Hedera Hashgraph: 33,562,400,523
Total Supply of HBAR: 50,000,000,000
Hedera Hashgraph CoinMarketCap Ranking: 33
Key Price Levels:
Resistance: $0.06565, $0.06600, and $0.06700
Support: $0.06500, $0.06400, and $0.06300
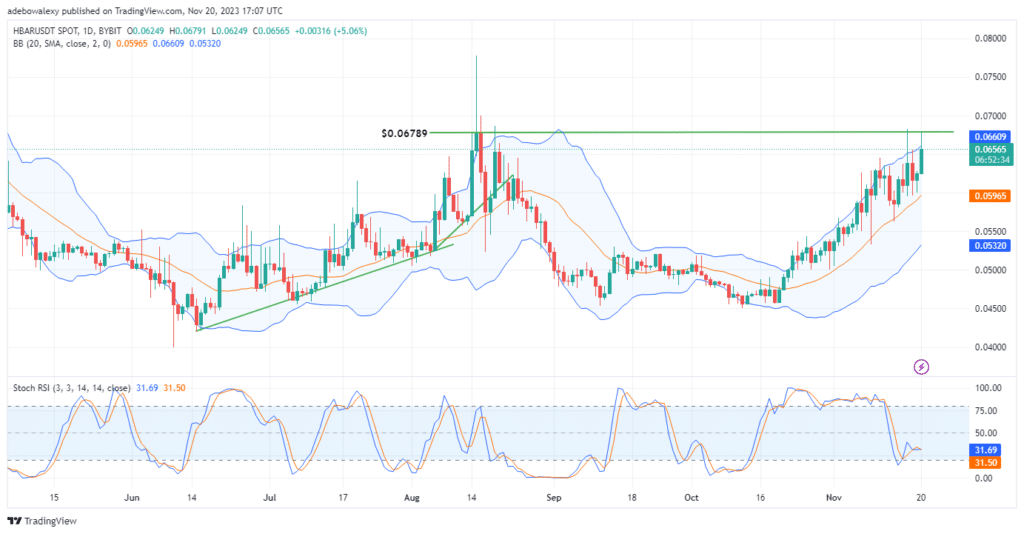
Hedera Hashgraph Targets the $0.06789 Price Level
HBAR has experienced a substantial price increase during today’s trading session, bringing the token within striking distance of a four-month resistance level at $0.06789. The ongoing upside trajectory is evident as trading activities persist above the middle band of the Bollinger Bands indicator.
The upper shadow of the current price candle is testing the aforementioned resistance level. Concurrently, the Relative Strength Index (RSI) indicator lines are converging rapidly for an upside crossover, suggesting that price action may gain further traction as trading progresses.
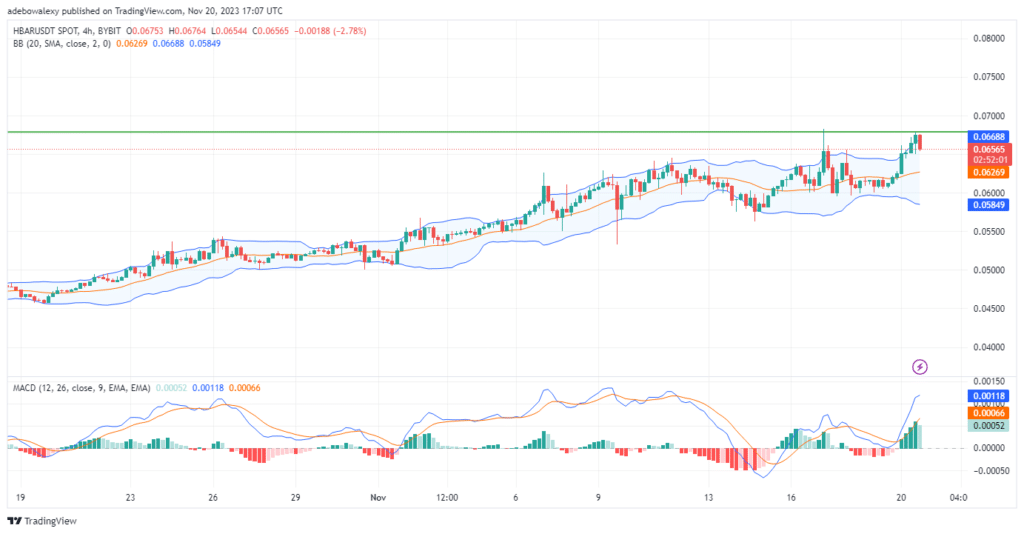
HBAR Faces Challenges from Headwinds
On the other hand, trading activities in the Hedera Hashgraph 4-hour market indicate that price action is encountering a degree of rejection, leading to some losses in this market. This can be observed in the last price candle on the 4-hour market chart. However, this could be considered a normal reaction, given that price action has pushed against the uppermost limit of the Bollinger Bands.
Despite this, trading activities remain above the middle limit of the Bollinger Bands. Additionally, the Moving Average Convergence Divergence (MACD) indicator lines are still above the equilibrium level, with the histogram bars in the ongoing session appearing pale green. Notwithstanding recent price history, the $0.06789 price level remains an achievable target.
- Broker
- Min Deposit
- Score
- Visit Broker

- Award-winning Cryptocurrency trading platform
- $100 minimum deposit,
- FCA & Cysec regulated

- 20% welcome bonus of upto $10,000
- Minimum deposit $100
- Verify your account before the bonus is credited
- Fund Moneta Markets account with a minimum of $250
- Opt in using the form to claim your 50% deposit bonus
Learn to Trade
Never Miss A Trade Again

Signal Notification
Real-time signal notifications whenever a signal is opened, closes or Updated

Get Alerts
Immediate alerts to your email and mobile phone.

Entry Price Levels
Entry price level for every signal Just choose one of our Top Brokers in the list above to get all this free.