Gold (XAUUSD) Market Analysis – July 20
Gold (XAUUSD)price falls back to the 1965.050 market level amidst bullish influence. Recently, the market has seen some interesting activity. After a long period of bullish influence, the buyers have dropped their guard and are taking a bite at the 1965.050 key level. Despite this pullback, the general trend is still predicting a long-term bullish tendency for gold prices. From the daily chart, we can see that the bulls are challenging the sellers. This has given them the opportunity to take control of the market.
XAUUSD Key Zones
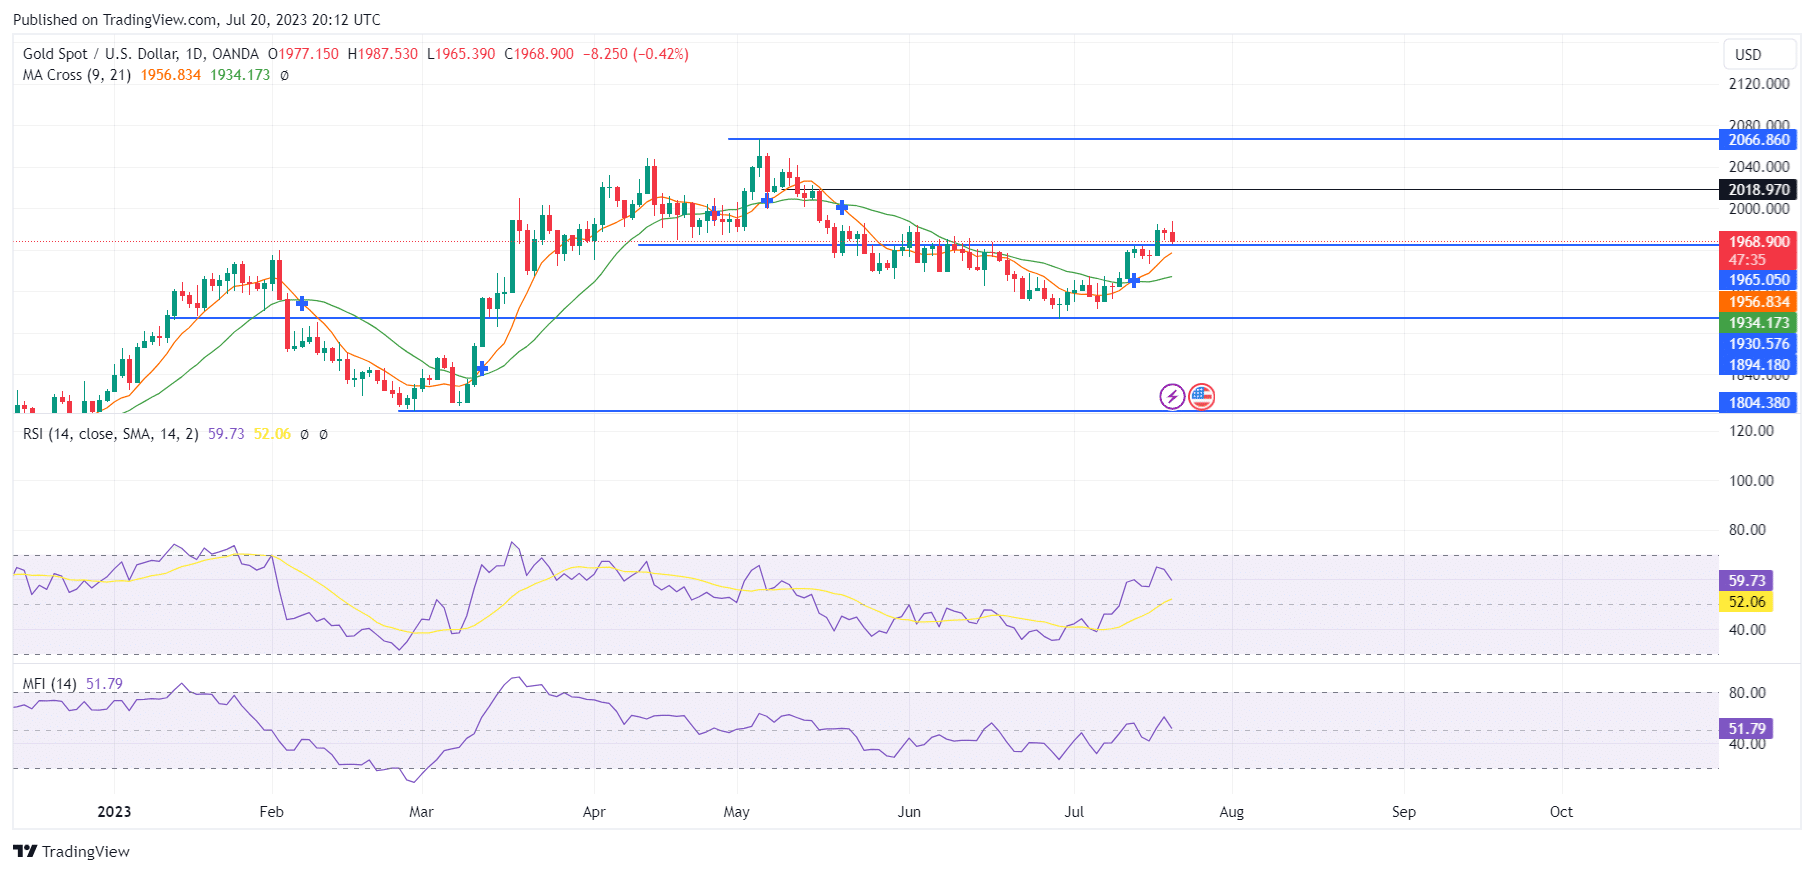
Resistance Zones: 2066.860, 2018.970
Support Zones: 1965.050, 930.570

Gold (XAUUSD) Long-Term Trend: Bullish
Gold (XAUUSD) sellers have caused a price flow from the 2066.860 market zone down to 1930.570. Since then, the buyers have been determined to change the price trend. They have pushed the market above the 1965.050 market zone now. This pullback to the key level shows that the buyers are still inclined to push further in the market. It implies they are not deterred by the current bearish activity. This could be indicative of a continued bullish trend for gold prices soon, just as it has been predicted by the general trend of the market.
The Moving Average crossing indicator is currently pointing in a bullish direction for the market. This is most likely due to the breakout above the 1965.050 level. This side has been a key area of support. There has been a pullback in the market, and this is being reflected in the RSI. But the market is still showing signs that it is ready to make further bullish progress.
Gold (XAUUSD) Short-Term Trend: Bearish
On the 4-hour chart, the price is still interacting around the 1965.050 level. This indicates that buyers are still in control of the market. It could therefore be an indication that further bullish momentum could be on the horizon. However, the RSI on the lower time frame is also indicating that there is a price pullback in the market. This could mean that the bullish trend is not as strong as it could be.
You can purchase Lucky Block – Guide, Tips & Insights | Learn 2 Trade here. Buy LBLOCK
Note: Learn2.trade is not a financial advisor. Do your research before investing your funds in any financial asset or presented product or event. We are not responsible for your investing results.
- Broker
- Min Deposit
- Score
- Visit Broker

- Award-winning Cryptocurrency trading platform
- $100 minimum deposit,
- FCA & Cysec regulated

- 20% welcome bonus of upto $10,000
- Minimum deposit $100
- Verify your account before the bonus is credited
- Fund Moneta Markets account with a minimum of $250
- Opt in using the form to claim your 50% deposit bonus
Learn to Trade
Never Miss A Trade Again

Signal Notification
Real-time signal notifications whenever a signal is opened, closes or Updated

Get Alerts
Immediate alerts to your email and mobile phone.

Entry Price Levels
Entry price level for every signal Just choose one of our Top Brokers in the list above to get all this free.