Don’t invest unless you’re prepared to lose all the money you invest. This is a high-risk investment and you are unlikely to be protected if something goes wrong. Take 2 minutes to learn more
Market Analysis – May 9
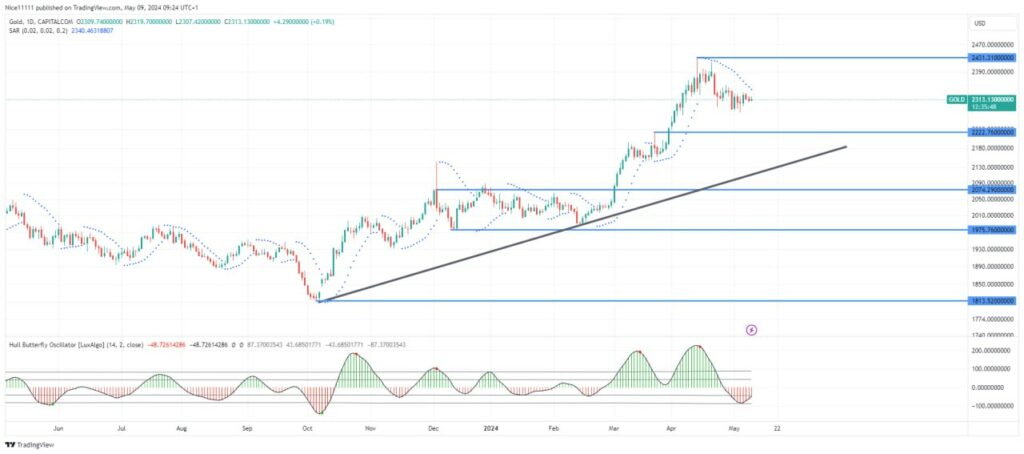
Gold has undergone a notable transformation this year, transitioning from a period of price stagnation to a robust uptrend. The breakout above the critical level of 2074.0 marked a significant turning point, fueling a sustained ascent in price. However, the recent emergence of a correction phase in the gold market suggests a temporary pause in this upward trajectory, with indications of waning bullish momentum.
Key Levels for Gold:
Demand Levels: 2223.0, 2074.0, 1976.9
Supply Levels: 2431.0, 2500.0, 2600.0
Gold Long-term Trend: Bullish
Despite the current correction, the long-term outlook for gold remains bullish. Examination of the daily chart reveals a series of major lows interconnected by a bullish trend line, providing insights for potential entry points for long positions. Traders may find opportunities to establish forex signals by monitoring the upcoming test of this trendline.
The placement of the Parabolic SAR (Stop and Reverse) points above the candlesticks signals an impending price decline. However, it’s noteworthy that the last significant demand zone at 2223.0 remains unbreached, suggesting that the current downturn in price is likely a retracement within the broader bullish trend.
Gold Short-term Trend: Ranging
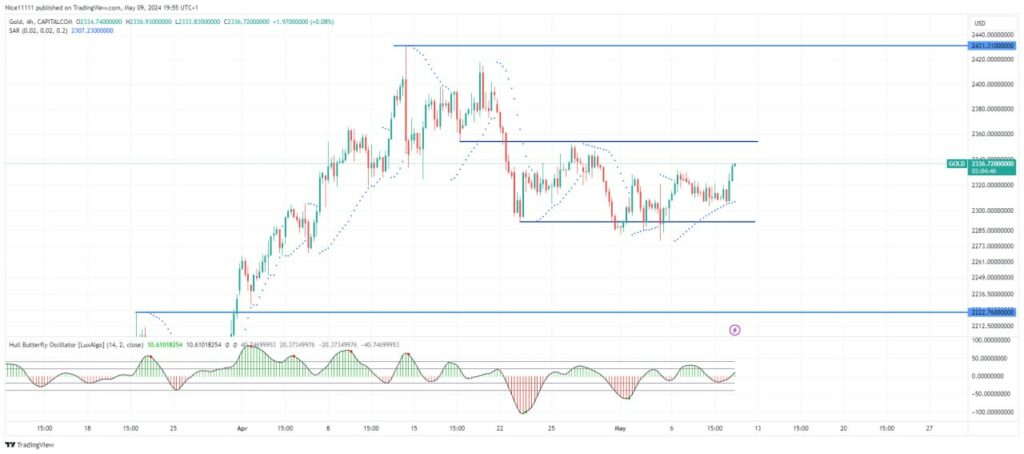
In contrast to the bullish long-term perspective, the short-term trend for gold appears bearish. A closer examination of the daily chart reveals a completed bearish reversal, particularly evident in the 4-hour timeframe. Within this shorter timeframe, gold is exhibiting a consolidation pattern, confined within the price range of 2355.0 to 2291.0. This consolidation may persist on the daily chart, prolonging the corrective phase.
You can purchase Lucky Block – Guide, Tips & Insights | Learn 2 Trade here. Buy LBLOCK
Note: Learn2.trade is not a financial advisor. Do your research before investing your funds in any financial asset or presented product or event. We are not responsible for your investing results.
- Broker
- Min Deposit
- Score
- Visit Broker

- Award-winning Cryptocurrency trading platform
- $100 minimum deposit,
- FCA & Cysec regulated

- 20% welcome bonus of upto $10,000
- Minimum deposit $100
- Verify your account before the bonus is credited
- Fund Moneta Markets account with a minimum of $250
- Opt in using the form to claim your 50% deposit bonus
Learn to Trade
Never Miss A Trade Again

Signal Notification
Real-time signal notifications whenever a signal is opened, closes or Updated

Get Alerts
Immediate alerts to your email and mobile phone.

Entry Price Levels
Entry price level for every signal Just choose one of our Top Brokers in the list above to get all this free.