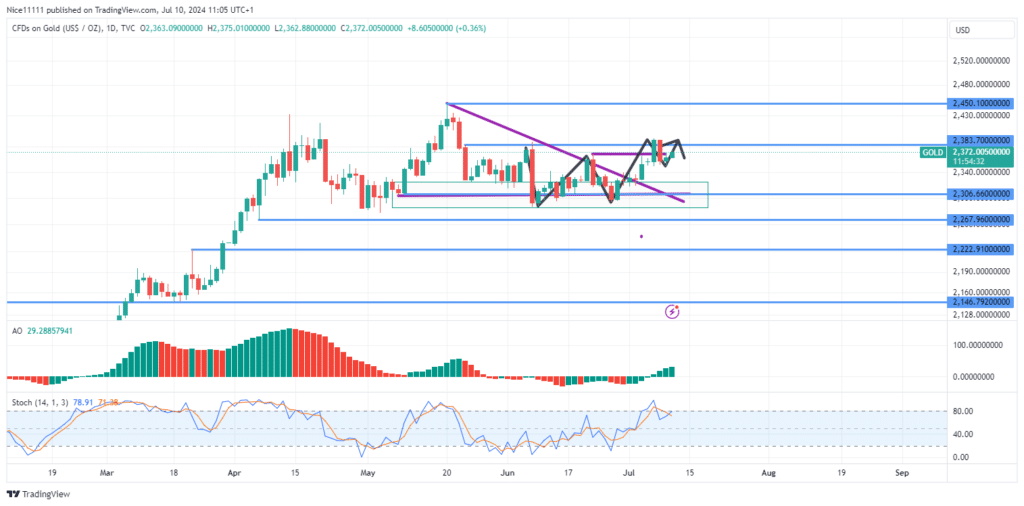
The Gold market witnessed a bearish shift in structure after reaching the swing high of 2450.0. The subsequent price decline halted at the demand zone of 2307.0, where a double bottom bullish reversal pattern formed. The neckline of this pattern has been surpassed, signaling a bullish recovery.
The Stochastic indicator revealed the exhaustion of Gold buyers when the all-time high of 2450 was reached, leading to a bearish shift in market structure as the previous bullish order block failed to hold. However, the demand zone at 2306 has provided substantial support, enabling buyers to regain their stance and enforce a reversal with a double bottom pattern.
The Awesome Oscillator shows a slow but gradual rise in bullish momentum. The price has surpassed the neckline of the double bottom pattern and the resistance level of 2384.0, before making a retest for a bullish continuation. This indicates a strengthening bullish outlook for Gold as seen on trading platforms.
Gold Short-Term Trend: Bullish
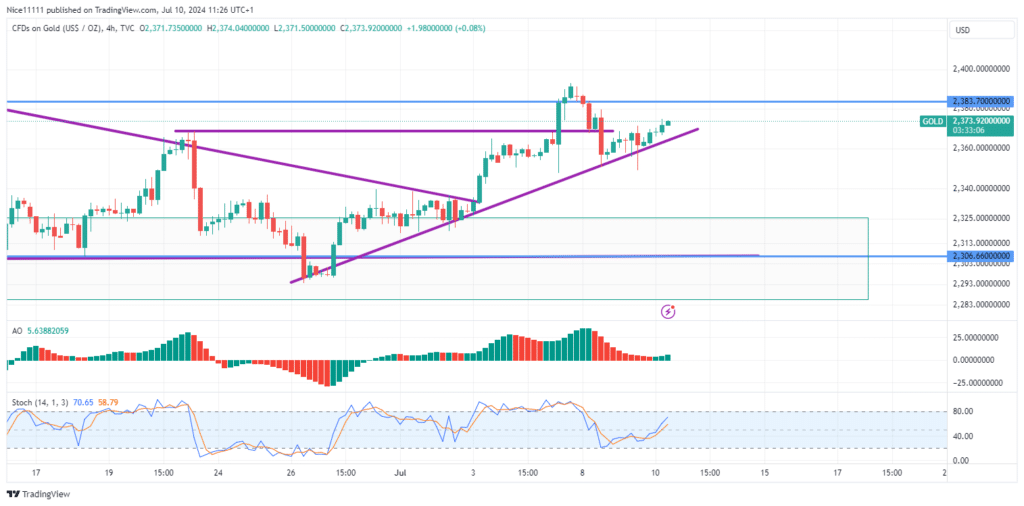
On the 4-hour chart, Gold is ascending with the aid of a bullish trendline. The Stochastic showed the price was oversold as the market pulled back to the trendline on the smaller time frame. The Awesome Oscillator indicates a slow but rising bullish momentum as the price moves away from the support trendline. This suggests a continued upward trajectory in the short term, reinforcing the overall bullish sentiment and providing reliable forex signals.
Note: Learn2.trade is not a financial advisor. Do your research before investing your funds in any financial asset, product, or event. We are not responsible for your investment results.
Trade on MT4 with Leverage up to 1:500! Trade on MT4 with Leverage up to 1:500!
X
We use cookies to ensure that we give you the best experience on our website. If you continue to use this site we will assume that you are happy with it.