Don’t invest unless you’re prepared to lose all the money you invest. This is a high-risk investment and you are unlikely to be protected if something goes wrong. Take 2 minutes to learn more
Market Analysis – May 2nd
The Gold market has taken a decisive turn, marking a significant departure from the protracted tug-of-war between bullish and bearish forces that characterized the trading landscape from November through February.
This period was marked by a pattern of fleeting rallies promptly neutralized by retracements, leading to a protracted phase of price stagnation. Technical indicators, specifically the Moving Averages with periods of 9 and 21, reflected this deadlock, as they remained entwined with the daily price candles signifying a market in a state of indecision.
Key Gold Price Levels:
Support: $2,223.00, $2,150.00, $1,913.00
Resistance: $2,417.00, $2,500.00, $2,600.00
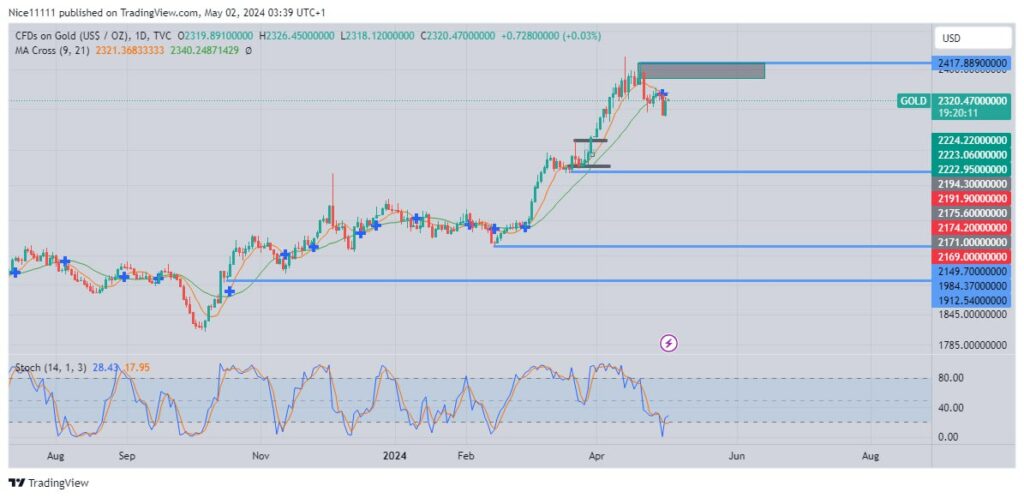
Gold Long-Term Trend: Bearish
During the consolidation phase, the Moving Averages, which are often looked upon for directional cues, were inconclusive in their positioning neither confirming a bullish breakout above the candles nor signaling a bearish downturn beneath them. Instead, they laid across the candle bodies, mirroring the market’s indecisiveness.
With the advent of the new year, however, a shift in momentum was observed. A bullish pattern, known as ‘Three White Soldiers,’ emerged, signaling a potential end to the consolidation. This was further corroborated by the Moving Averages repositioning themselves to provide support beneath the daily candles from February until April, indicating a newfound determination among buyers.

Short-Term Gold Trend: Bearish
Recent activity on the daily chart reveals a decisive drop in price below the Moving Average, suggesting a bearish outlook. This sentiment is echoed in the four-hour chart, which displays a double break of structure (BOS)—a bearish indicator. A divergence is presented with the Stochastic oscillator nearing overbought conditions on the four-hour chart, in contrast to an oversold Stochastic on the daily chart.
For traders, this suggests a prudent approach, recommending patience and a confirmation of oversold conditions across both timeframes before considering entry into short positions. It is crucial to align with the broader market sentiment to capitalize on potential downward movements in the Gold market.
You can purchase Lucky Block – Guide, Tips & Insights | Learn 2 Trade here. Buy LBLOCK
Note: Learn2.trade is not a financial advisor. Do your research before investing your funds in any financial asset or presented product or event. We are not responsible for your investing results.
- Broker
- Min Deposit
- Score
- Visit Broker

- Award-winning Cryptocurrency trading platform
- $100 minimum deposit,
- FCA & Cysec regulated

- 20% welcome bonus of upto $10,000
- Minimum deposit $100
- Verify your account before the bonus is credited
- Fund Moneta Markets account with a minimum of $250
- Opt in using the form to claim your 50% deposit bonus
Learn to Trade
Never Miss A Trade Again

Signal Notification
Real-time signal notifications whenever a signal is opened, closes or Updated

Get Alerts
Immediate alerts to your email and mobile phone.

Entry Price Levels
Entry price level for every signal Just choose one of our Top Brokers in the list above to get all this free.