

Market Analysis – July 14
Gold has consistently struggled to break above the major supply zone at 3430.0 since April. Despite several attempts to surpass this resistance, the latest effort also fell short, leading to a retracement. The price has now dropped to a critical confluence area defined by the intersection of a well-established ascending trendline and a key horizontal support level—offering a solid foundation for potential renewed bullish momentum.
Gold Key Levels
Demand Levels: 3245.0, 3136.0, 2956.0
Supply Levels: 3430.0, 3500.0, 3600.0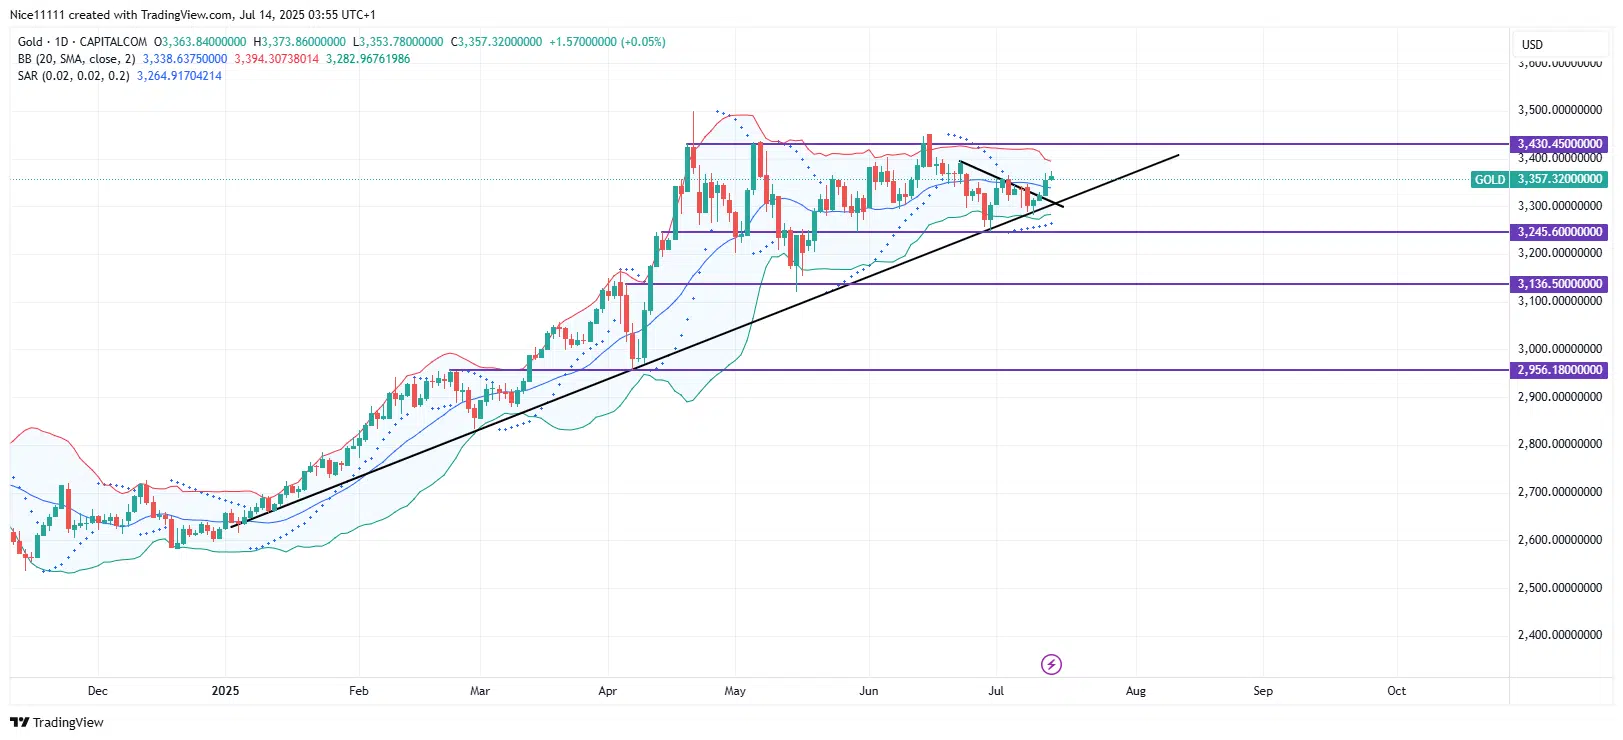
Gold Long-Term Trend: Bullish
Following a strong bullish impulse that reached 3430.0, gold entered a corrective phase. However, this pullback has not disrupted the broader bullish trend, particularly as immediate support at 3245.0 continues to cushion the market against deeper retracements caused by overhead supply.
In June, price action tested the 3430.0 level for the third time, forming a triple top pattern—signaling exhaustion at that resistance zone. This rejection aligned with the price touching the upper band of the Bollinger Bands, indicating an overextended market condition that triggered the recent downward move.
The decline that followed was relatively measured, with the price slightly extending below the lower Bollinger Band before stabilizing. Support was promptly established at 3245.0, where it aligned with a rising bullish trendline—forming a classic pullback setup that may lead to a rebound or a continuation of the bullish trend. Traders may look to enhance their strategies with accurate forex signals during this phase.
Gold Short-Term Trend: Bullish
Make money without lifting your fingers: Start using a world-class auto trading solution
How To Buy Lucky Block
Note: Learn2.trade is not a financial advisor. Do your research before investing your funds in any financial asset, product, or event. We are not responsible for your investment results.


