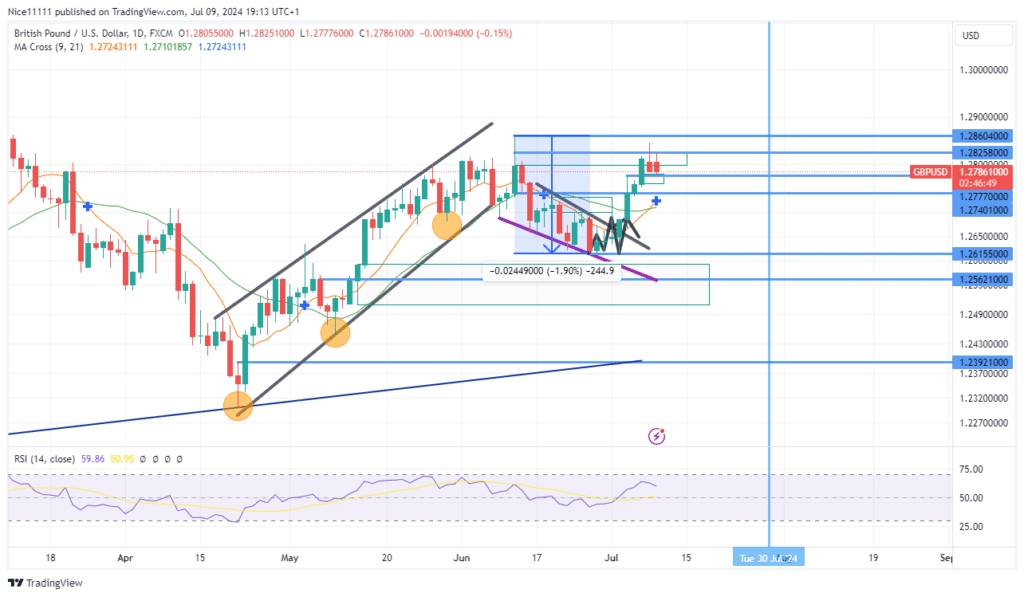
The GBPUSD pair surged towards the swing high of 1.2860 but encountered resistance at a fair value gap of 1.2810. This resistance has led to a pullback in price on the daily chart. The price rise of GBPUSD was halted just before reaching the swing high of 1.2860. The reason for this pause is evident in the 4-hour time frame.
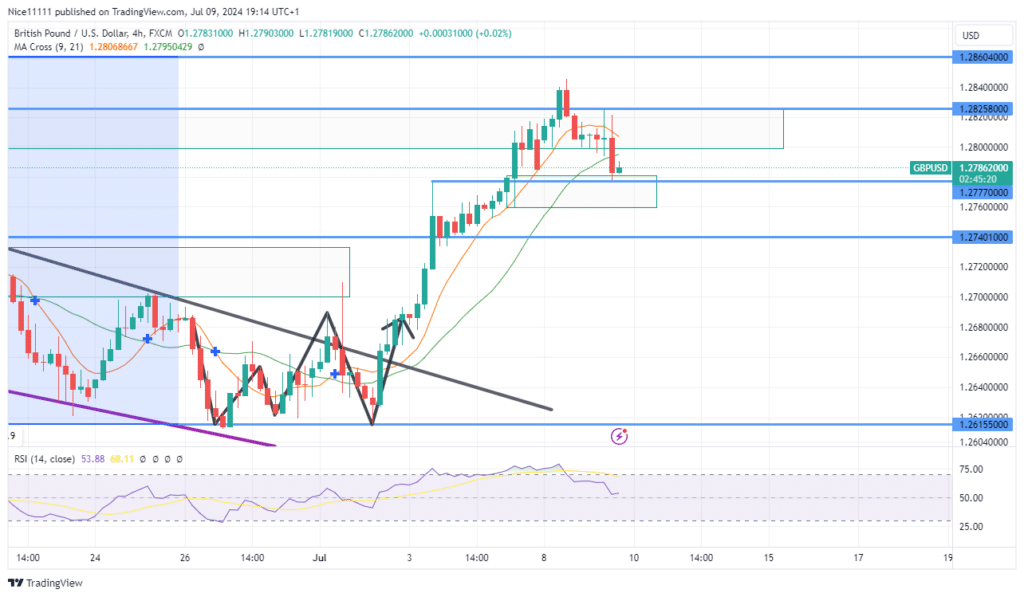
On the 4-hour chart, GBPUSD was oversold at the demand level of 1.2620 as seen on trading platforms. Following the formation of a triple bottom reversal pattern, the price began to rise, with the Moving Averages (periods 9 and 21) tracking this momentum. The price rally continued strongly until it was impeded by a fair value gap at 1.2860, which lies within the premium zone of the previous trend.
Upon hitting the fair value gap, the Relative Strength Index (RSI) signaled an overbought market. Consequently, although the rally was robust enough to fill the gap, the price formed an arc and started to decline, falling below the Moving Averages (periods 9 and 21), indicating a downward trend.
GBPUSD Short-Term Trend
In the short term, GBPUSD has dipped into a bullish breaker at 1.2780 on the daily chart. This could restore the bullish momentum, allowing the pair to surpass June’s high of 1.2860. The lower timeframe can therefore be critical when generating reliable forex signals as it helps provide insights and actionable information for effective trading decisions.
Note: Learn2.trade is not a financial advisor. Do your research before investing your funds in any financial asset, product, or event. We are not responsible for your investment results.
Trade on MT4 with Leverage up to 1:500! Trade on MT4 with Leverage up to 1:500!
X
We use cookies to ensure that we give you the best experience on our website. If you continue to use this site we will assume that you are happy with it.