Market Analysis – August 11
GBPUSD continues to face extended downside risk, with the daily chart showing the pair under persistent bearish pressure. Recent trading activity remains below the short-term 9-day Simple Moving Average (SMA) at $1.33320, reinforcing the prevailing negative bias.
Although the RSI has rebounded to 53.86, signaling some short-term recovery momentum, the broader structure still aligns with a bearish outlook following the prior break of structure (BOS) to the downside. Current price action at $1.34660 sits within a wider resistance zone capped by $1.35890 and $1.36320, a range that continues to limit bullish advances and sustain bearish sentiment.
GBPUSD Key Levels
Supply Levels: $1.3630, $1.3800, $1.4000
Demand Levels: $1.3330, $1.3050, $1.2710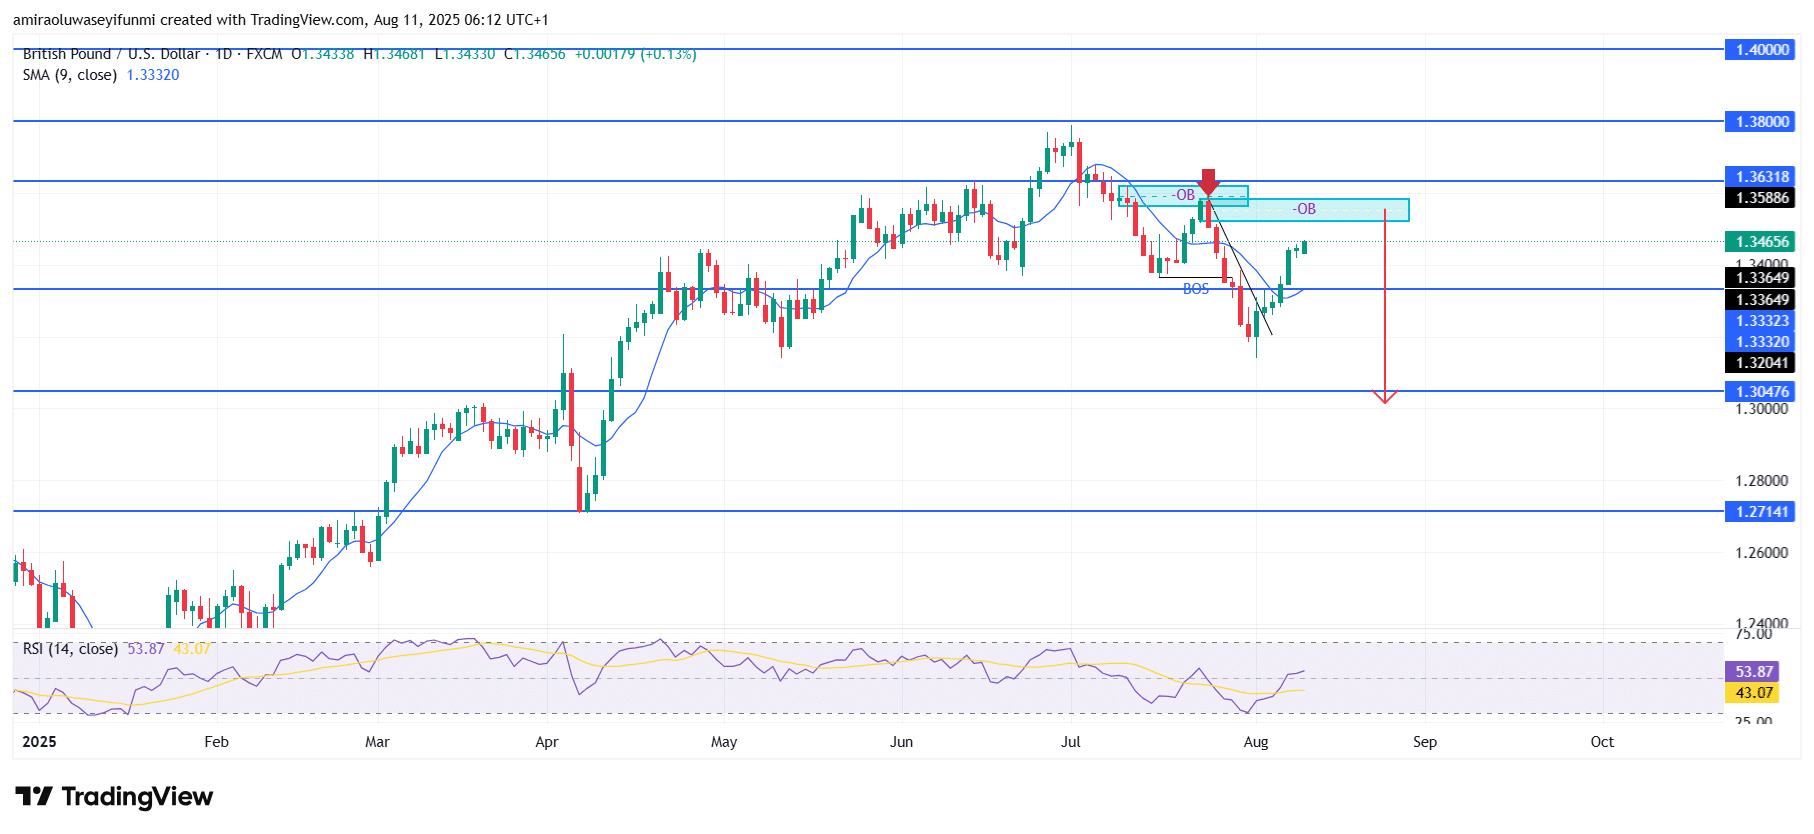
GBPUSD Long-Term Trend: Bearish
Price action shows a clear rejection from the order block near $1.35890, followed by a decisive drop below the $1.33650 support before retracing higher. The recent bullish pullback appears corrective, with price approaching the previously broken demand zone—now functioning as a supply zone between $1.33650 and $1.36320. Each rally within this structure has met renewed selling pressure, confirming the market’s bearish tone.
Looking ahead, the bearish scenario remains intact as long as price fails to hold above $1.36320. Rejection within this supply zone could trigger a fresh decline toward $1.33320 and $1.32040, with the possibility of an extended move to the $1.30480 support zone. If selling momentum strengthens further, a medium-term test of $1.27140 could follow. Alternatively, only a sustained breakout above $1.36320 would challenge this outlook, potentially paving the way for a move toward $1.38000. Traders monitoring forex signals may find these levels significant in shaping their positioning strategies.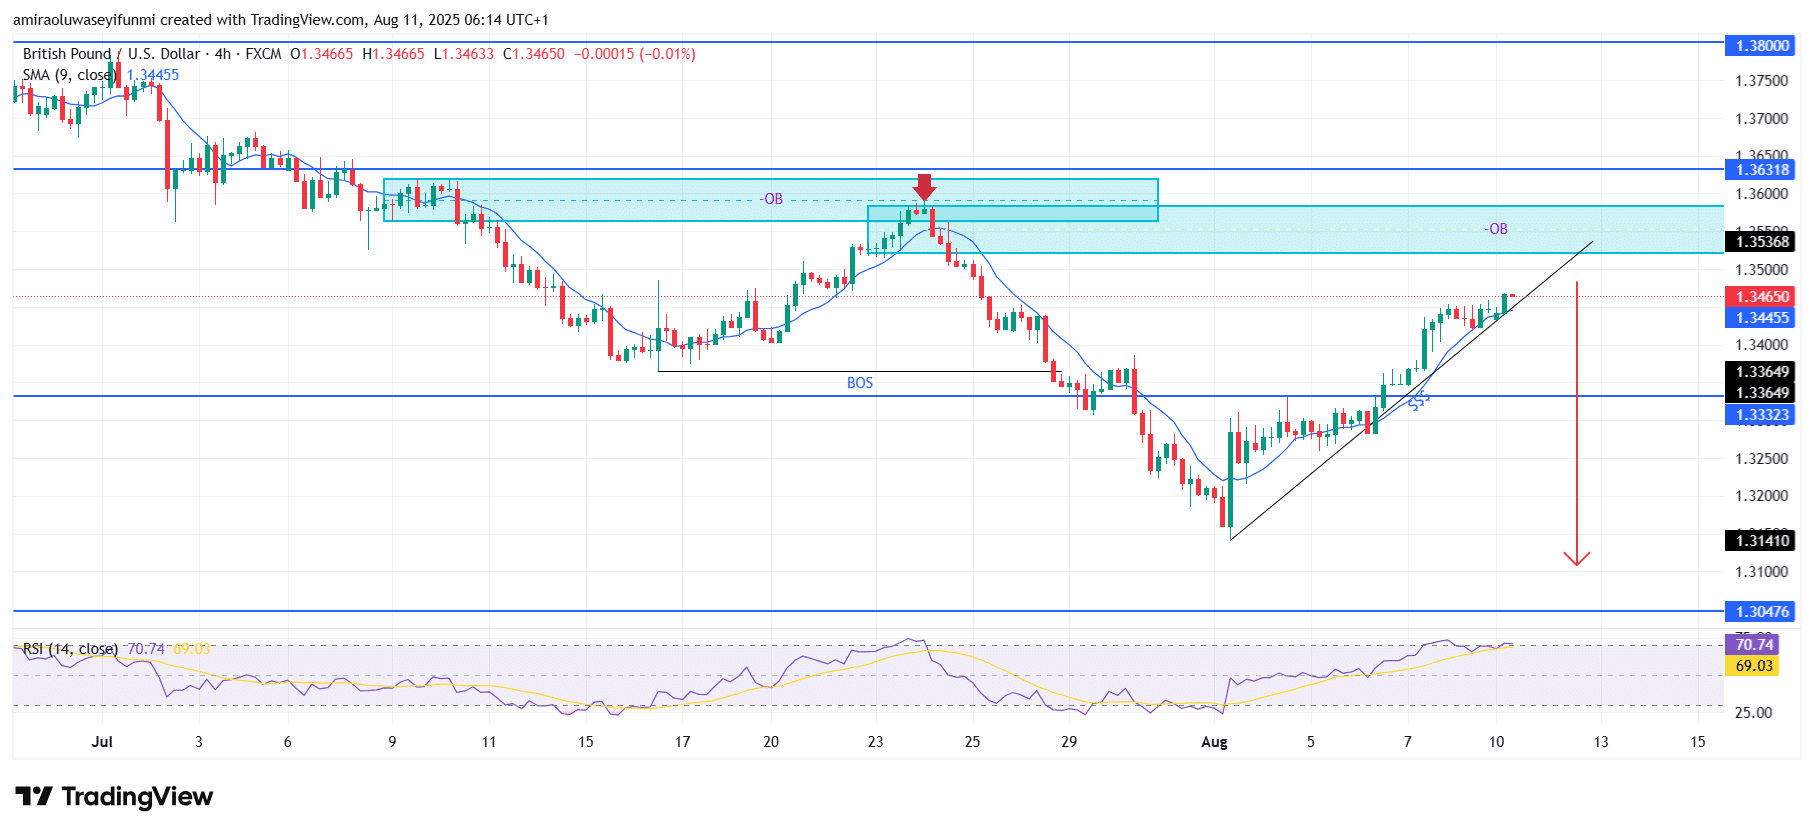
GBPUSD Short-Term Trend: Bearish
In the short term, GBPUSD is approaching a key supply zone near $1.35370 after a strong corrective rally from the $1.31410 low. Price is moving within an ascending channel, but momentum is showing signs of fading as RSI hovers around the overbought level at 70.82.
The prevailing structure remains bearish following the earlier break of structure and rejection from the order block zone. A rejection in this area could trigger a move lower toward $1.33320, with the potential for a further drop to $1.31410.
Make money without lifting your fingers: Start using a world-class auto trading solution
How To Buy Lucky Block – Guide, Tips & Insights | Learn 2 Trade
Note: Learn2.trade is not a financial advisor. Do your research before investing your funds in any financial asset, product, or event. We are not responsible for your investment results.
- Broker
- Min Deposit
- Score
- Visit Broker

- Award-winning Cryptocurrency trading platform
- $100 minimum deposit,
- FCA & Cysec regulated

- 20% welcome bonus of upto $10,000
- Minimum deposit $100
- Verify your account before the bonus is credited
- Fund Moneta Markets account with a minimum of $250
- Opt in using the form to claim your 50% deposit bonus
Learn to Trade
Never Miss A Trade Again

Signal Notification
Real-time signal notifications whenever a signal is opened, closes or Updated

Get Alerts
Immediate alerts to your email and mobile phone.

Entry Price Levels
Entry price level for every signal Just choose one of our Top Brokers in the list above to get all this free.