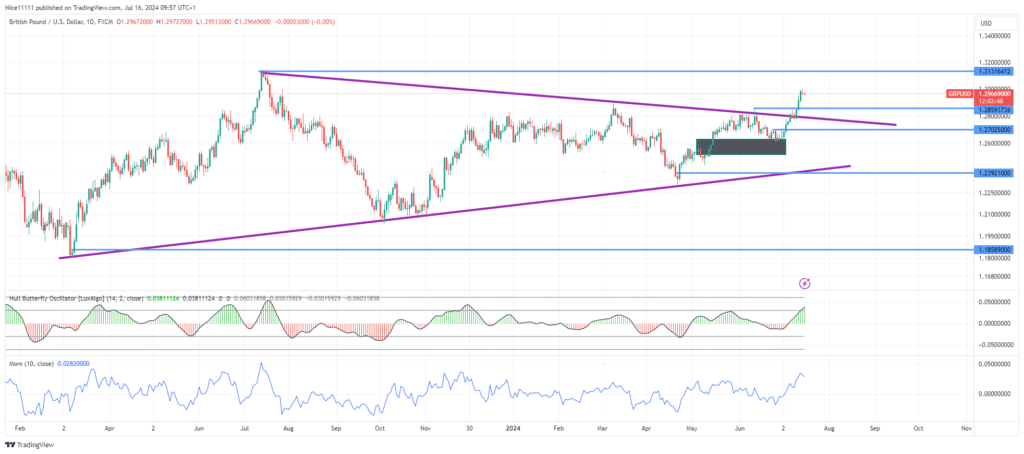
GBPUSD bulls have successfully enforced a breakout from a symmetrical triangle on the daily chart. The bullish momentum was remarkable, highlighted by the appearance of the three white soldiers pattern just before and immediately after hitting the resistance trendline of the symmetrical triangle.
A triple top pattern led to a price reversal after testing the resistance trendline on the GBPUSD daily chart in June. The price pulled back to a breaker block within the range of a fair value gap, providing support.
The Hull Butterfly Indicator turned bullish after testing the breaker block in late June. This shift led to a price surge back to the resistance trendline. The ascent paused at the resistance trendline for two days before the uptrend resumed. The momentum of the bullish trend is currently at its highest since the beginning of the year, as indicated by the Momentum Indicator.
Short-Term Trend: Bullish
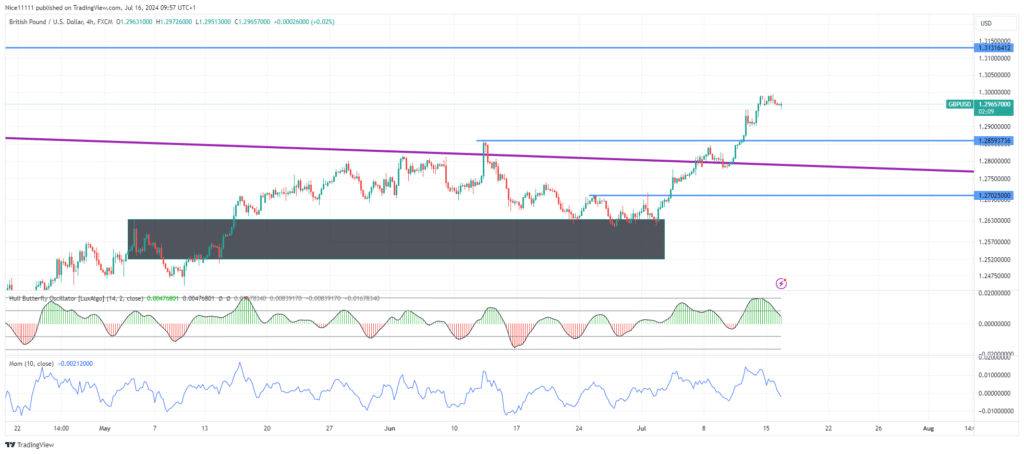
The next resistance level in sight is the swing high of 1.3140, which would be a desirable target according to the best forex signals. On the lower timeframe, the price is pulling back to a bullish order block, which is expected to foster the continued rise of GBPUSD’s price.
Note: Learn2.trade is not a financial advisor. Do your research before investing your funds in any financial asset, product, or event. We are not responsible for your investment results.
Trade on MT4 with Leverage up to 1:500! Trade on MT4 with Leverage up to 1:500!
X
We use cookies to ensure that we give you the best experience on our website. If you continue to use this site we will assume that you are happy with it.