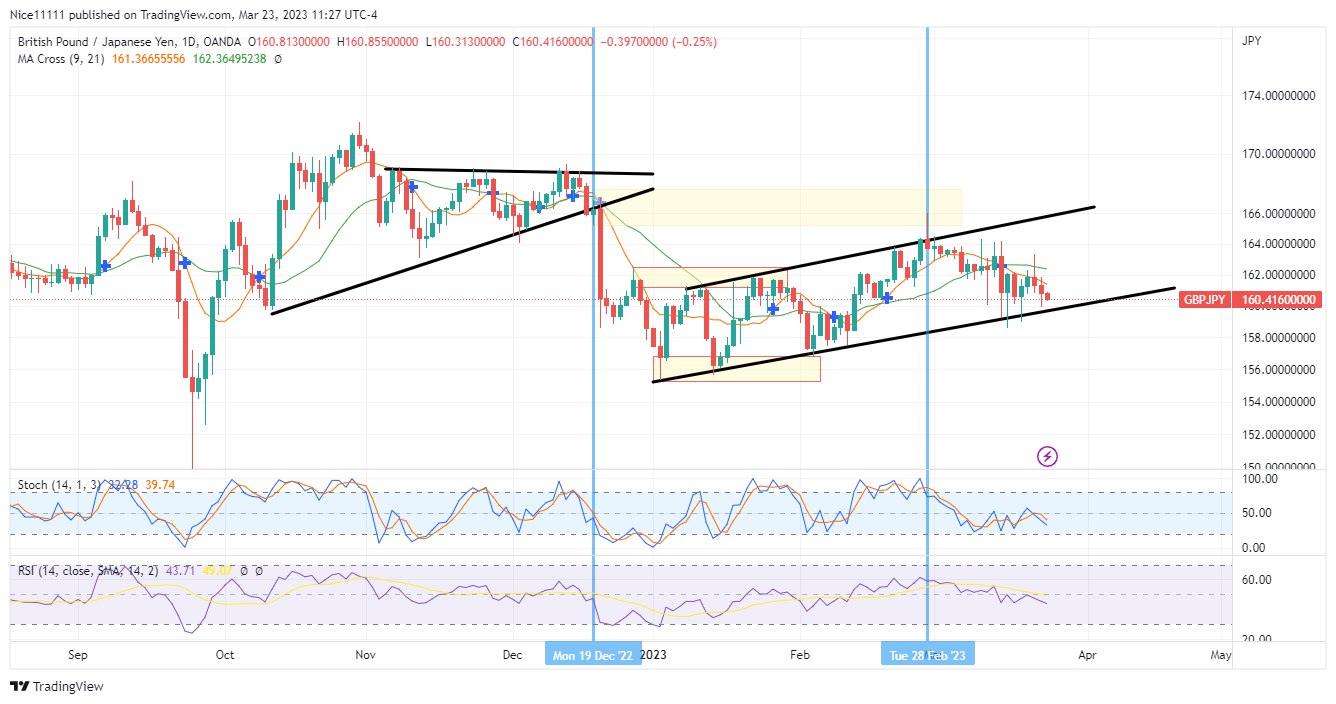
GBPJPY is currently rising within a parallel channel on the daily chart. The market experienced resistance after driving into a bearish order block formed on the 20th of December. This has caused a decline in the supporting trendline of the parallel channel.
The market experienced a crash in September. The price dropped rapidly from the 168.0 resistance level to the 150.0 demand level within two weeks. The recovery of the price was immediate after the sighting of a prominent rejection candle that stretched into the demand level. The structure turned bullish until a head and shoulders pattern formed after the market tested the 172.0 supply level.
On the daily chart, equal highs and higher lows formed an ascending triangle. A sudden plunge in the price was experienced on the 20th of December. A large fair-value gap was exposed as the market continued to decline. The direction of the market changed after the price reached the support level of 156.0. Higher highs and lows have formed with a very gentle slope. The gap created on December 20 has been filled up.
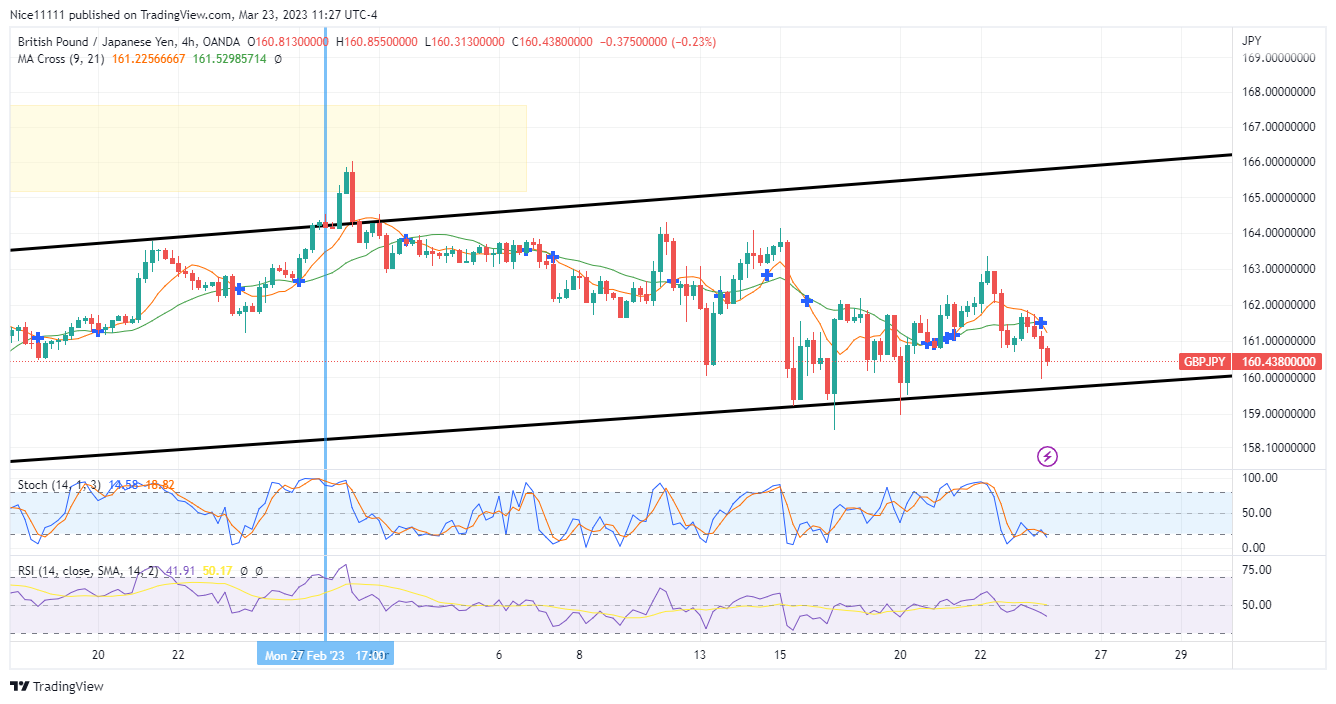
GBPJPY Short-term Trend: Bearish
The upper border of the parallel channel formed a confluence with the bearish order block on the daily chart. As the market approached the order block region, the Stochastic signaled overbought. The resistance faced by the order block has caused the market to turn bearish on the lower timeframe. The supporting trendline is expected to support the price to rise beyond the 168.0 resistance level.
Trade on MT4 with Leverage up to 1:500! Trade on MT4 with Leverage up to 1:500!
X
We use cookies to ensure that we give you the best experience on our website. If you continue to use this site we will assume that you are happy with it.