GBPJPY is set to keep its downtrend movement following a sharp pullback. However, this is because the market’s sellers are exerting additional pressure on the market. As the price continues to fall in a downward trend, there are significant pullbacks as key levels are retested. This demonstrates that after a downturn, there has been a sharp rebound to major key levels. These levels are now being retested.
GBPJPY Significant Zone
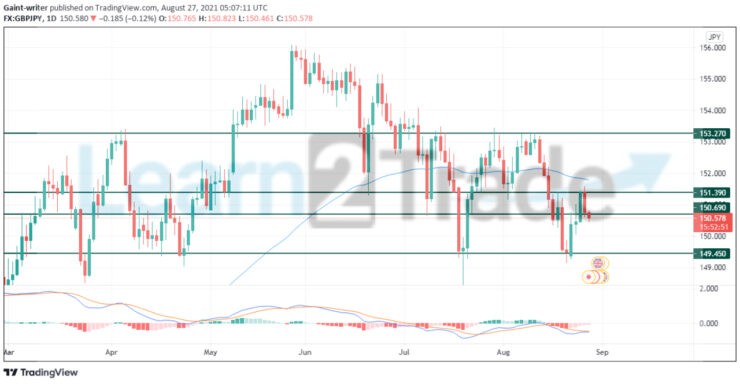
Resistance Levels: 153.270, 151.390 Support Levels: 150.690, 149.450
GBPJPY Long Term Trend: Bearish
GBPJBY resumed its downtrend movement after retesting the resistance level at 153.270. Price breaks through the resistance level of 151.390 and the support level of 150.690. Since the bulls seek to retake control, there was a significant fallback to the 151.390 resistance level. The market is now assumed to continue its downward trend movement as more bulls seem to be losing power and the bears take control. Following the retest, the market is clear to resume its downtrend movement.
Following the pullback at the key level resistance zone of 151.390, the price has now broken through the key level support zone of 150.690. However, GBPJPY is clear to break through the previous old low support level at 149.450, forming a new lower bottom. The MACD (Moving Average Convergence Divergence) indicator is displaying a cross below the zero mark. This gives us a strong indication of the direction of a downtrend movement following a sharp pullback. Price is expected to maintain its bearish momentum after breaking through the 149.450 support key level.
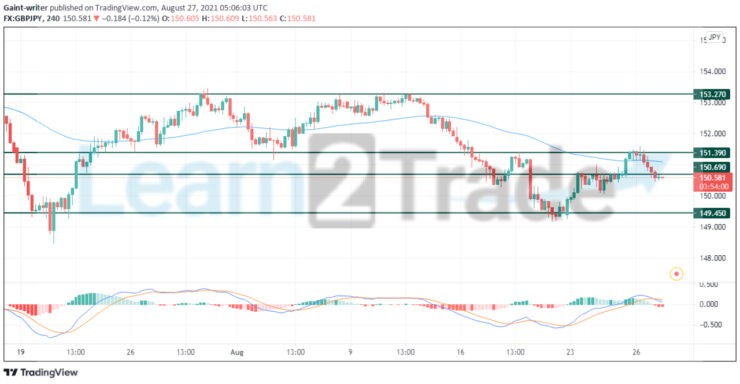
GBPJPY Short Term Trend: Bearish
On the 4-hour chart, the price is also set to assume a downtrend following a sharp pullback to 151.390 key level. Following that, the market is expected to rally downward. The EMA 80 (Exponential Moving Average) indicator is serving as a resistance, and the price is responding to it as well. This certainly indicates that we are in a downward trend movement. MACD is also set to pass the zero level after displaying a bearish histogram. As a result, this also indicates a declining tendency. However, the price will continue to fall towards the 149.450 support level.
Note:Learn2.trade is not a financial advisor. Do your research before investing your funds in any financial asset or presented product or event. We are not responsible for your investing results.
Trade on MT4 with Leverage up to 1:500! Trade on MT4 with Leverage up to 1:500!
X
We use cookies to ensure that we give you the best experience on our website. If you continue to use this site we will assume that you are happy with it.