GBPJPY bulls wield strength across the bearish path back to151.870. The significant zone serves as a major zone for several reactions. The market responses comprise the bullish-shaped influence as they are ready to impact the price action of the market. The price, therefore, consists of several points of the response of the buyers and sellers as we accept a major pullback, it withdraws at a significant level. Currently, the entire market sphere is still being bullied by bears following the downward movement.
GBPJPY Significant Zones:
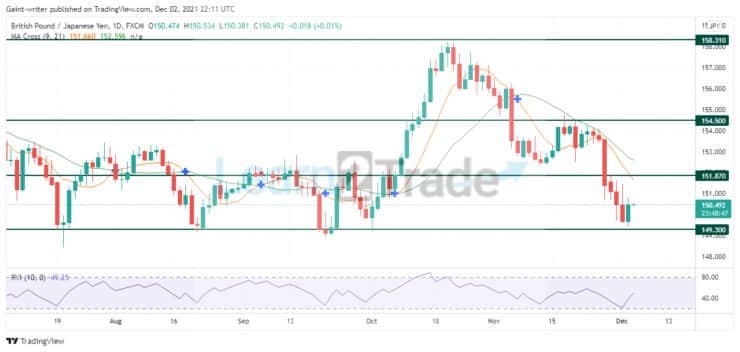
Resistance Zones: 158.310, 154.500 Support Zones: 151.870, 149.300
GBPJPY Long Term Trend: Bullish
Before price consideration in the bear’s session, there had been several tests hit at a specific zone of 149.300 level. This zone in the market serves as an end level where the overall price trend is seen to fall to. The price, therefore, first experienced a significant order flow at this level. As the bulls engaged in the market at this level, the sellers also brought the market down near this level, and this process was repeated for a long time before the bulls’ uprising. After a rebound at this 149.300 significant level, they chose their path upward, following their momentum strength.
GBPJPY price was overtaken by the bears around the 158.310 level of significance. The bears finally forged their path to wielding the price downward. The price movement experienced a huge drop to various levels of significance as the bulls also wish to wield their strength in the market. The sellers eventually got back to the 149.300 level of consequence, and the bulls were prepared to withdraw price against the bearish path in the market direction. The RVI (Relative Volume Index) shows an increase in the relative volume distribution as the pullback is evident on the 1-day chart.
GBPJPY Short Term Trend: Bullish
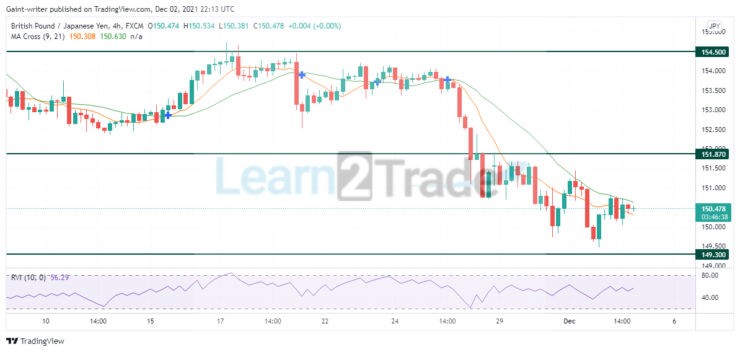
The 4-hour chart also shows a big deal in the market structure. The price is falling in a bearish trend towards the 149.300 significant point. The bulls are now seen to be wielding their strength upward against the sellers’ path. The Moving Crossing indicator shows the two signal lines showering over price levels without a cross to show that the market is still bearish as we anticipate a rebound to the 151.870 price level before bears’ engagement.
Note:Learn2.trade is not a financial advisor. Do your research before investing your funds in any financial asset or presented product or event. We are not responsible for your investing results.
Trade on MT4 with Leverage up to 1:500! Trade on MT4 with Leverage up to 1:500!
X
We use cookies to ensure that we give you the best experience on our website. If you continue to use this site we will assume that you are happy with it.