

Technical indicators:
Major Resistance Levels – 1.2800, 1.2900, 1.3000
Major Support Levels – 1.1900, 1.1800, 1.1700
GBP/USD Long-Term Analysis: Bullish
GBP/USD is in an upward correction as it faces rejection at level 1.2300. Since July 27, the currency pair has been trading between the moving average lines. Buyers could not keep the price above the resistance at level 1.2300. Each time the 50-day line SMA is broken, the market would decline below the 50-day line SMA. On August 10, the bulls broke the 50-day line SMA but it was repelled. Today, the pair is declining to the range-bound zone.
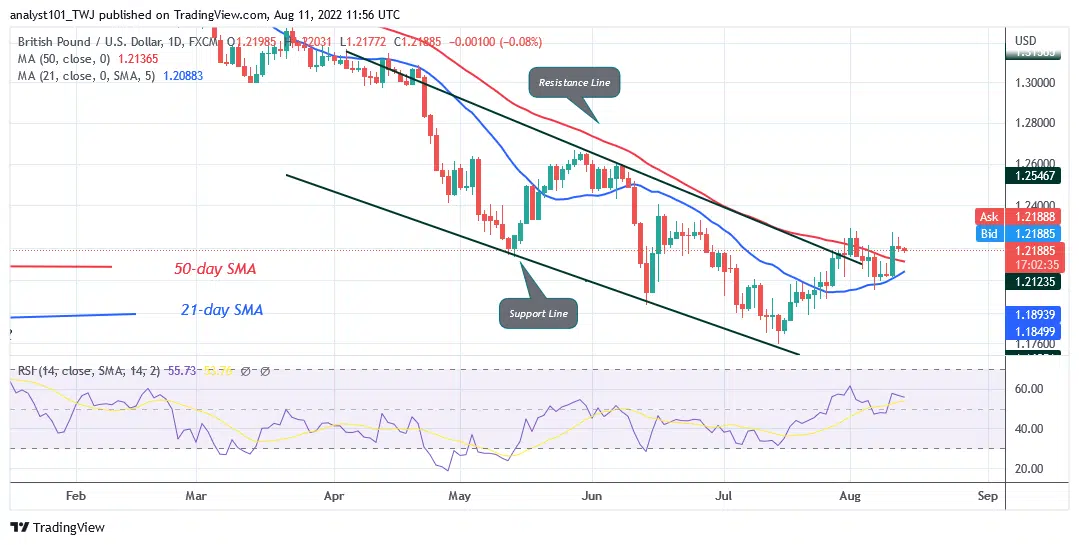
GBPUSD Indicator Analysis
The Pound is at level 55 of the Relative Strength Index for period 14. It indicates that the pair is in the uptrend zone despite the retracement. The currency price is above moving average lines but it is retracing to the range-bound zone. The pair is above the 50% range of the daily stochastic. GBP/USD is in a bullish momentum.
What Is the Next Direction for GBP/USD?
On the 4-hour chart, the Pound is in a sideways move as it faces rejection at level 1.2300. Since August 1, the upward move is hindered at the resistance of level 1.2250. The pair is trading below the recent high. The uptrend will resume if the resistance is breached.

You can purchase crypto coins here. Buy LBLOCK
Note: Learn2.Trade is not a financial advisor. Do your research before investing your funds in any financial asset or presented product or event. We are not responsible for your investing


