
Key Resistance Levels: 1.4200, 1.4400, 1.4600
Key Support Levels: 1.3400, 1.3200, 1.3000
GBP/USD Price Long-term Trend: Bullish
GBP/USD has resumed a strong bullish momentum. The pound rebounded above level 1.3800 and rallied above level 1.3950. The Relative Strength Index period 14 indicates that the pound is in the uptrend zone and it is approaching the overbought region. The pound is retesting the resistance at level 1.4000.
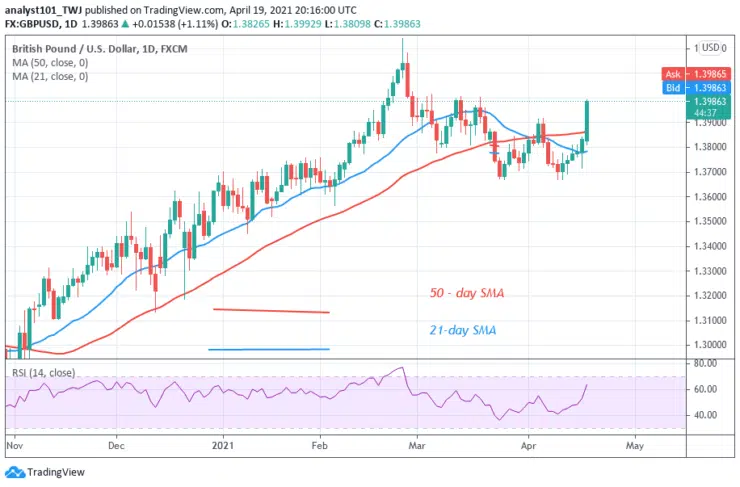
Daily Chart Indicators Reading:
The 21-day and 50-SMAs are sloping upward. The crypto’s price is above the moving averages which indicates a further upward move. The 21-day SMA and 50-day SMA are sloping upward indicating the uptrend.
GBP/USD Medium-term Trend: Bullish
On the 3-hour chart, the pair has resumed an upward move. On April 14 uptrend; a retraced candle body tested the 50% Fibonacci retracement level. The retracement indicates that the pair is likely to rise to level 2.0 Fibonacci extension or level 1.3919. From the price action, the pound has risen above the Fibonacci level.

Note: Learn2.Trade is not a financial advisor. Do your research before investing your funds in any financial asset or presented product or event. We are not responsible for your investing results


