Don’t invest unless you’re prepared to lose all the money you invest. This is a high-risk investment and you are unlikely to be protected if something goes wrong. Take 2 minutes to learn more
FUNToken (FUNUSDT) Price Forecast: April 7
The FUNUSDT market has been relatively stable in the past few days, presenting a strong resistance level at a$0.0101. The coin is recovering, showing signs of market revitalization. Thus, a daily candlestick above the mentioned supply level would invalidate any bearish theory. As a result, if buyers can put more effort into their market tension, the trend will shift above the $0.0101 current level, resulting in an intraday gain and a potential buy signal for the coin holders.
Key Levels:
Resistance Levels: $0.0069, $0.0070, $0.0071
Support Levels: $0.0023, $0.0024, $0.0025
FUN (USDT) Long-term Trend: Bullish (Daily Chart)
The FUNToken market remains bullish and presents a strong resistance level in the higher time frames. This is obvious because prices are trading at the upper resistance area above the EMA-50 due to the significant impact of buy investors.  .0101" width="1281" height="496" data-lazy-src="https://learn2.trade/wp-content/uploads/2025/04/FUNUSDT-MON-LNT.png"/>
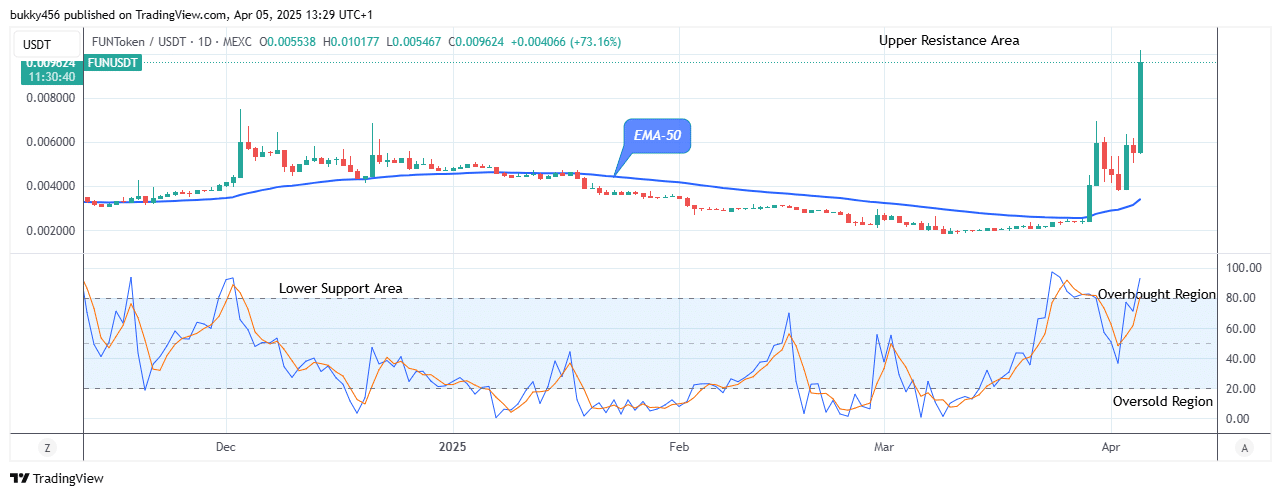
Today’s daily chart shows a broader recovery in prices as the bulls took their stand to continue trending up. The FUNUSDT price jumped up to a $0.0101 resistance level above the EMA-50 at the time of writing this article.
As a result, staying at the upper resistance level above the EMA-50 indicates a high likelihood of a bullish correction. A strong breakup above the $0.0101 current resistance level would amplify bullish pressure.
Meanwhile, the market price of FUNToken is pointing up on the daily stochastic, suggesting that the bulls may continue trending up.
Hence, the expected upside move in the coin price could be high at $0.0105 value as soon as the token presents a strong resistance level in its long-term outlook.
FUN (USDT) Medium-term Trend: Bullish (4H Chart)
The FUNUSDT pair is trending up and presents a strong resistance level in its medium-term outlook. Furthermore, the pair is close to the upper resistance levels above the 50-day moving average, indicating an uptrend..0101" width="1281" height="496" data-lazy-src="https://learn2.trade/wp-content/uploads/2025/04/FUNUSDT-MON-MDT.png"/>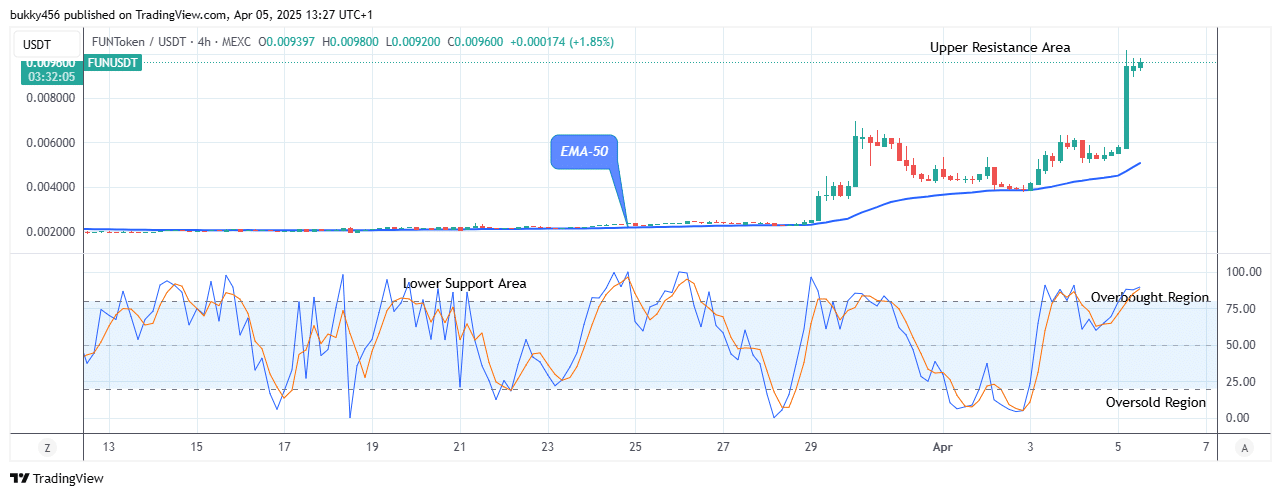
As the 4-hour chart resumes today, the bulls have reached a high of $0.0098 close to the upper resistance level above the EMA-50.
However, the buy traders could not relent, as they aim to continue trending up and drag the price of FUNToken further to a significant level.
Furthermore, an increase in the buying pressure might lead the token price to hit the $0.0101 resistance level.
However, the bullish correction at the mentioned resistance level is an indication that the bulls are planning to move the price of FUNUSDT to a high level and the $0.0105 upper high mark might be the target in the days ahead in its medium-term.
Buy FUNToken on eightcap.com
- Broker
- Min Deposit
- Score
- Visit Broker

- Award-winning Cryptocurrency trading platform
- $100 minimum deposit,
- FCA & Cysec regulated

- 20% welcome bonus of upto $10,000
- Minimum deposit $100
- Verify your account before the bonus is credited
- Fund Moneta Markets account with a minimum of $250
- Opt in using the form to claim your 50% deposit bonus
Learn to Trade
Never Miss A Trade Again

Signal Notification
Real-time signal notifications whenever a signal is opened, closes or Updated

Get Alerts
Immediate alerts to your email and mobile phone.

Entry Price Levels
Entry price level for every signal Just choose one of our Top Brokers in the list above to get all this free.