
Resistance Level: 7500, 7600, 7700
Support Level: 7300, 7200, 7100
FTSE 100 (UKX) Long-term Trend: Bullish
FTSE 100 is in an uptrend. Presently, the uptrend is facing resistance at level 6800. Since January 6, the upward move has been facing rejection from the recent high. Today, the price is falling after testing the resistance zone. The Share will fall to level 6400 if the selling pressure persists.
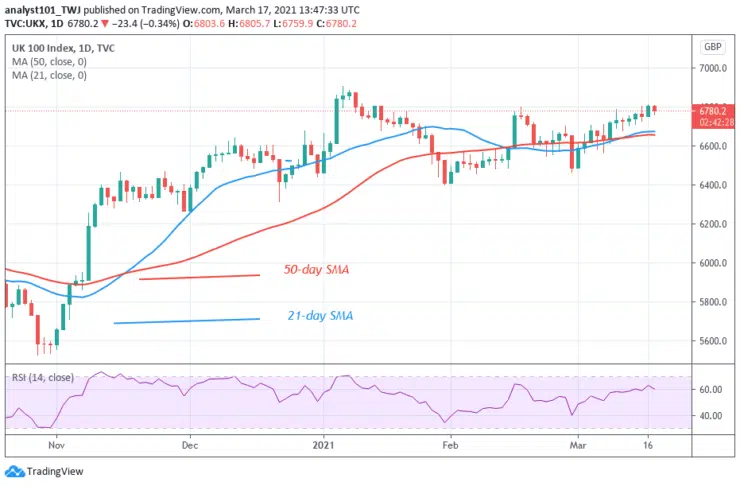
Daily Chart Indicators Reading:
The 21-day SMA and 50-day SMA are sloping upward indicating the trend. Presently, the share is at level 60 of the Relative Strength Index. It indicates that the UKX is in the uptrend zone and above the centerline of 50.
FTSE 100 (UKX) Medium-term Trend: Bullish
On the 4-hour chart, the share is in an uptrend. The bulls have tested the 6800 resistance and have been repelled twice. On March 9 uptrend; a retraced candle body tested the 61.8% Fibonacci retracement level. The retracement indicates that the share will rise to level 1.618 Fibonacci extensions or level 6893.30.


