FTSE 100 Analysis – September 3
FTSE 100 signals an extended bearish retracement within the corrective phase. The FTSE 100 Index is currently undergoing a notable pullback as momentum indicators point to weakening buying pressure. The price has slipped below the short-term moving average positioned near $9,240, with the RSI easing from its overbought region and settling at 46, reflecting diminishing bullish strength. This setup underscores a corrective phase after the index’s earlier rally, showing that sellers are beginning to take greater control of short-term movement.
FTSE 100 Key Levels
Resistance Levels: $9200, $9520, $9700
Support Levels: $8900, $8480, $8110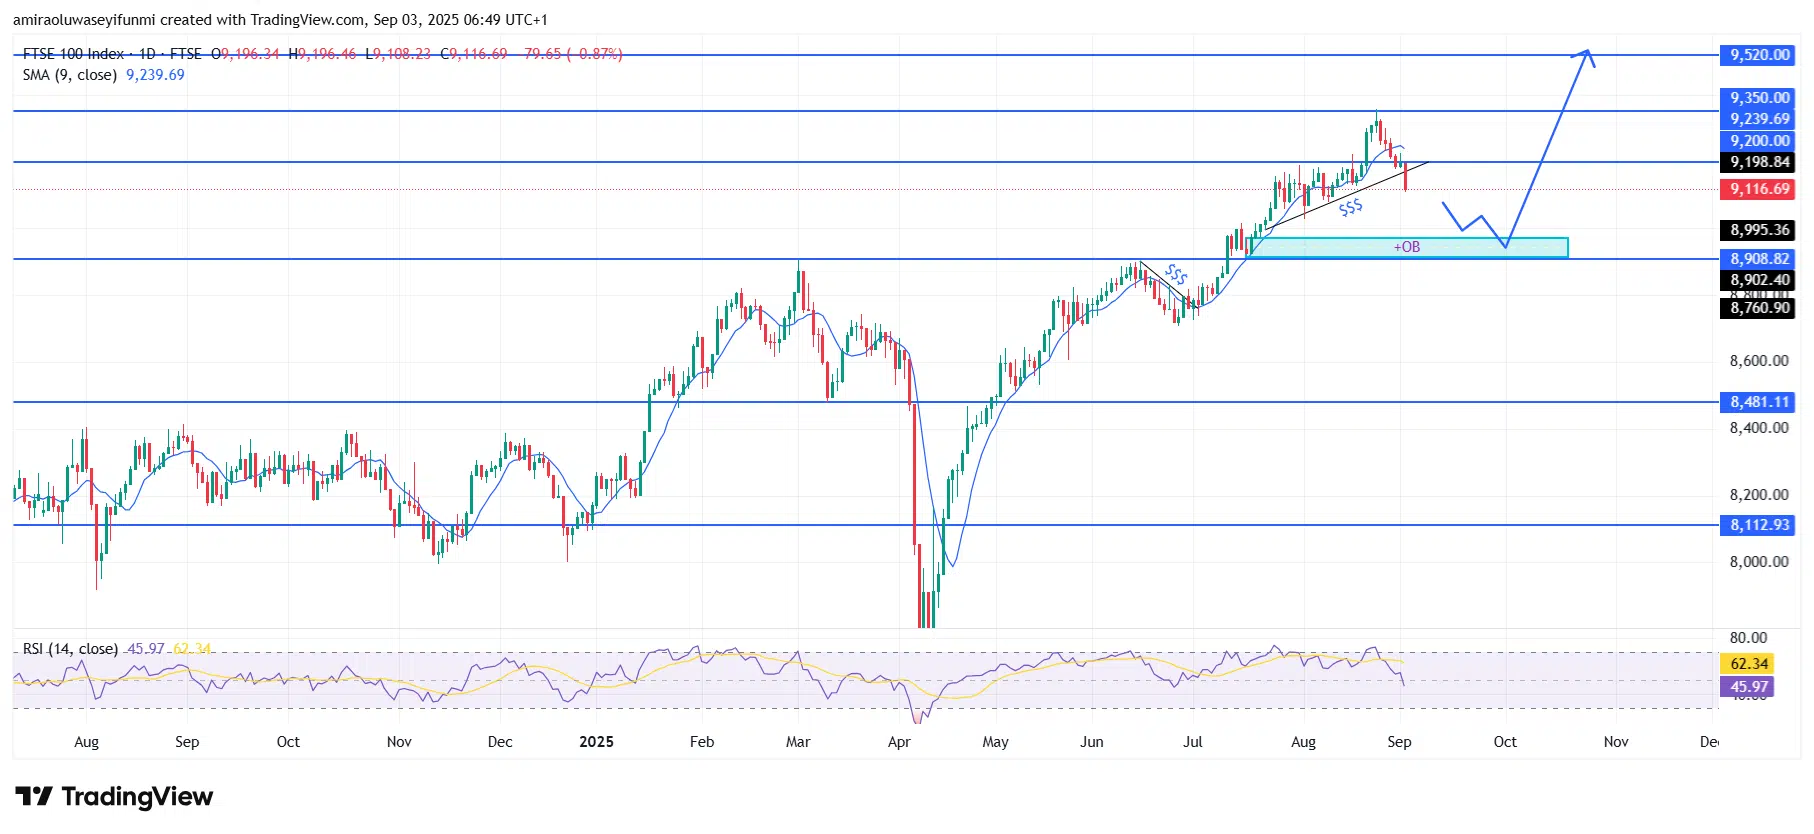
FTSE 100 Long-Term Trend: Bullish
Price action has moved below the $9,200 threshold and is now testing the $9,120 region, a critical support zone. This structure indicates that buyers failed to maintain higher levels, leading to downward pressure toward the $9,000–$8,910 range, where a prior order block has been identified. A clear break beneath this zone could expose the index to further weakness, potentially retesting the $8,760 level as the next structural support.
Looking ahead, the broader market outlook suggests the retracement may extend before any significant recovery begins. If sellers push the index below $8,910, deeper downside toward $8,480 is possible, in line with historical liquidity areas. However, if the market stabilizes around the $8,900 zone, a recovery toward $9,200 and potentially a retest of $9,350 could follow in upcoming sessions. This indicates that while the index is in a short-term corrective phase, medium-term prospects remain favorable for renewed bullish momentum once equilibrium is restored. Traders monitoring forex signals may also find correlations within this market behavior.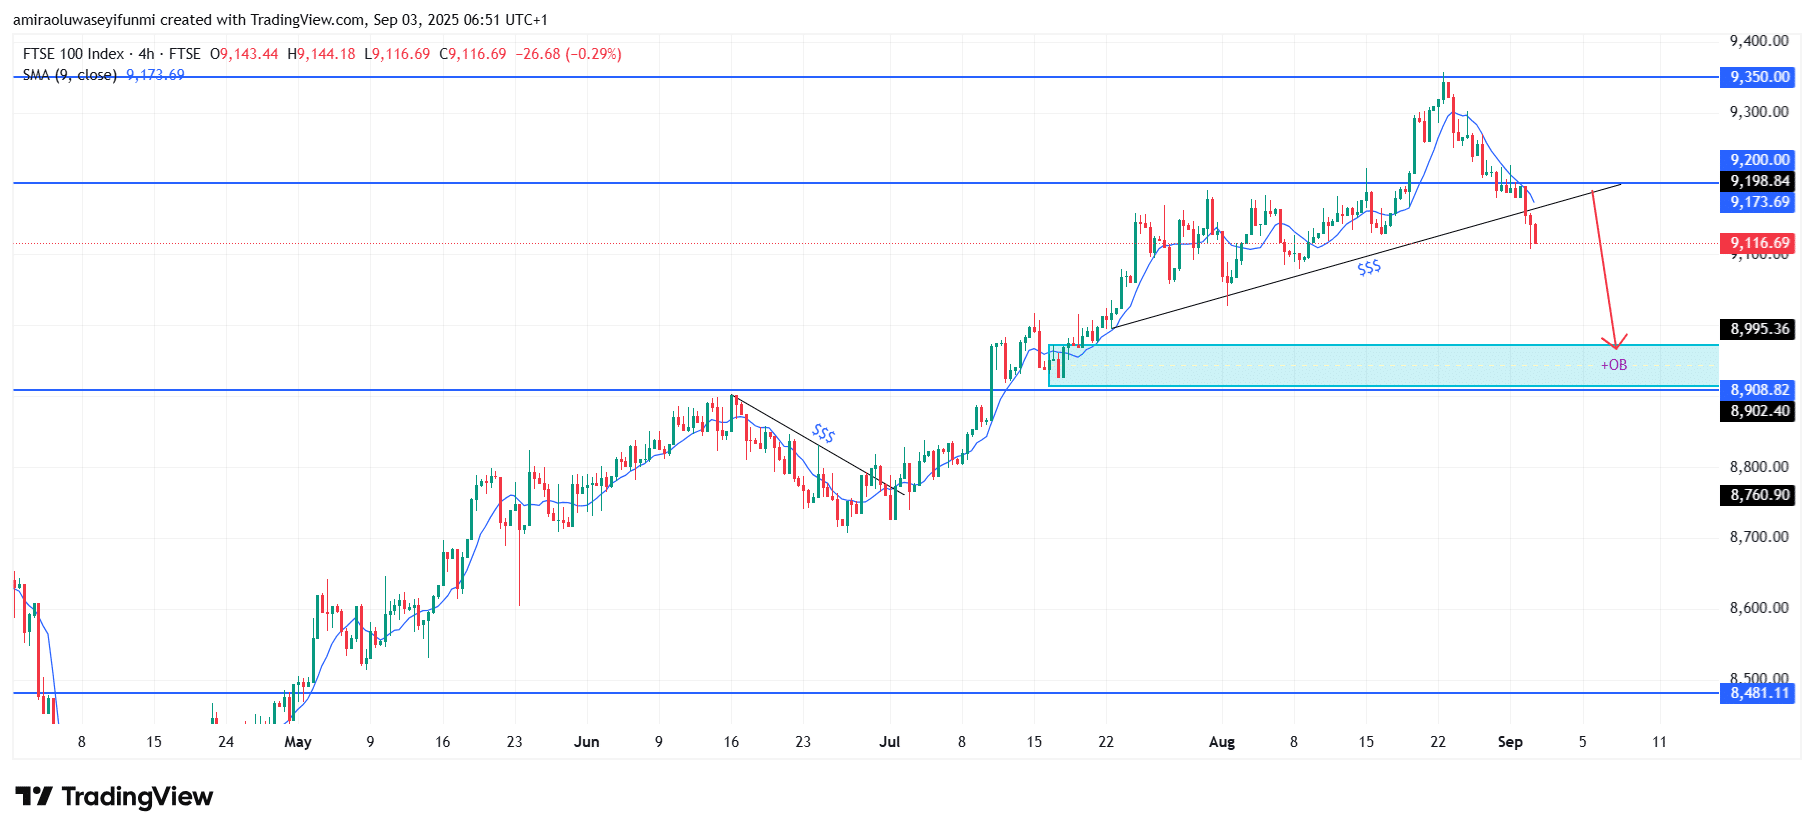
FTSE 100 Short-Term Trend: Bullish
On the four-hour chart, the FTSE 100 shows persistent bearish pressure as price action moves below the $9,200 support level. Sellers have broken beneath the ascending trendline, confirming weakness in the recent bullish structure.
The next downside target is located around the $9,000–$8,910 demand zone, where prior order block support remains. Failure to defend this region could accelerate declines toward $8,760 in the near term.
Make money without lifting your fingers: Start using a world-class auto trading solution
How To Buy Lucky Block – Guide, Tips & Insights | Learn 2 Trade
Note: Learn2.trade is not a financial advisor. Do your research before investing your funds in any financial asset, product, or event. We are not responsible for your investment results.
- Broker
- Min Deposit
- Score
- Visit Broker

- Award-winning Cryptocurrency trading platform
- $100 minimum deposit,
- FCA & Cysec regulated

- 20% welcome bonus of upto $10,000
- Minimum deposit $100
- Verify your account before the bonus is credited
- Fund Moneta Markets account with a minimum of $250
- Opt in using the form to claim your 50% deposit bonus
Learn to Trade
Never Miss A Trade Again

Signal Notification
Real-time signal notifications whenever a signal is opened, closes or Updated

Get Alerts
Immediate alerts to your email and mobile phone.

Entry Price Levels
Entry price level for every signal Just choose one of our Top Brokers in the list above to get all this free.