FTSE 100 Analysis – April 2
FTSE 100 is exhibiting early bearish signals, pointing to a possible downside risk. The index is currently trading below the 9-day SMA (Simple Moving Average) at approximately $8,620, highlighting a decline in bullish momentum. The RSI (Relative Strength Index) is around 35, indicating that the index is approaching oversold levels but still has room to fall further. The downward slope of the moving average reinforces the bearish sentiment as the index continues to struggle with reclaiming key resistance levels.
FTSE 100 Key Levels
Resistance Levels: $8600, $8800, $9000
Support Levels: $8480, $8370, $8110
FTSE100 Long-Term Trend: Bearish
The current price action confirms a bearish market structure. A clear break of structure (BOS) occurred around $8,480, followed by a bearish order block (OB) formed near $8,620. The market had previously rejected the $8,800 resistance level, resulting in a lower high before breaking below support. This shift in market structure indicates increasing control by sellers, and the formation of a new lower low further supports the ongoing downtrend.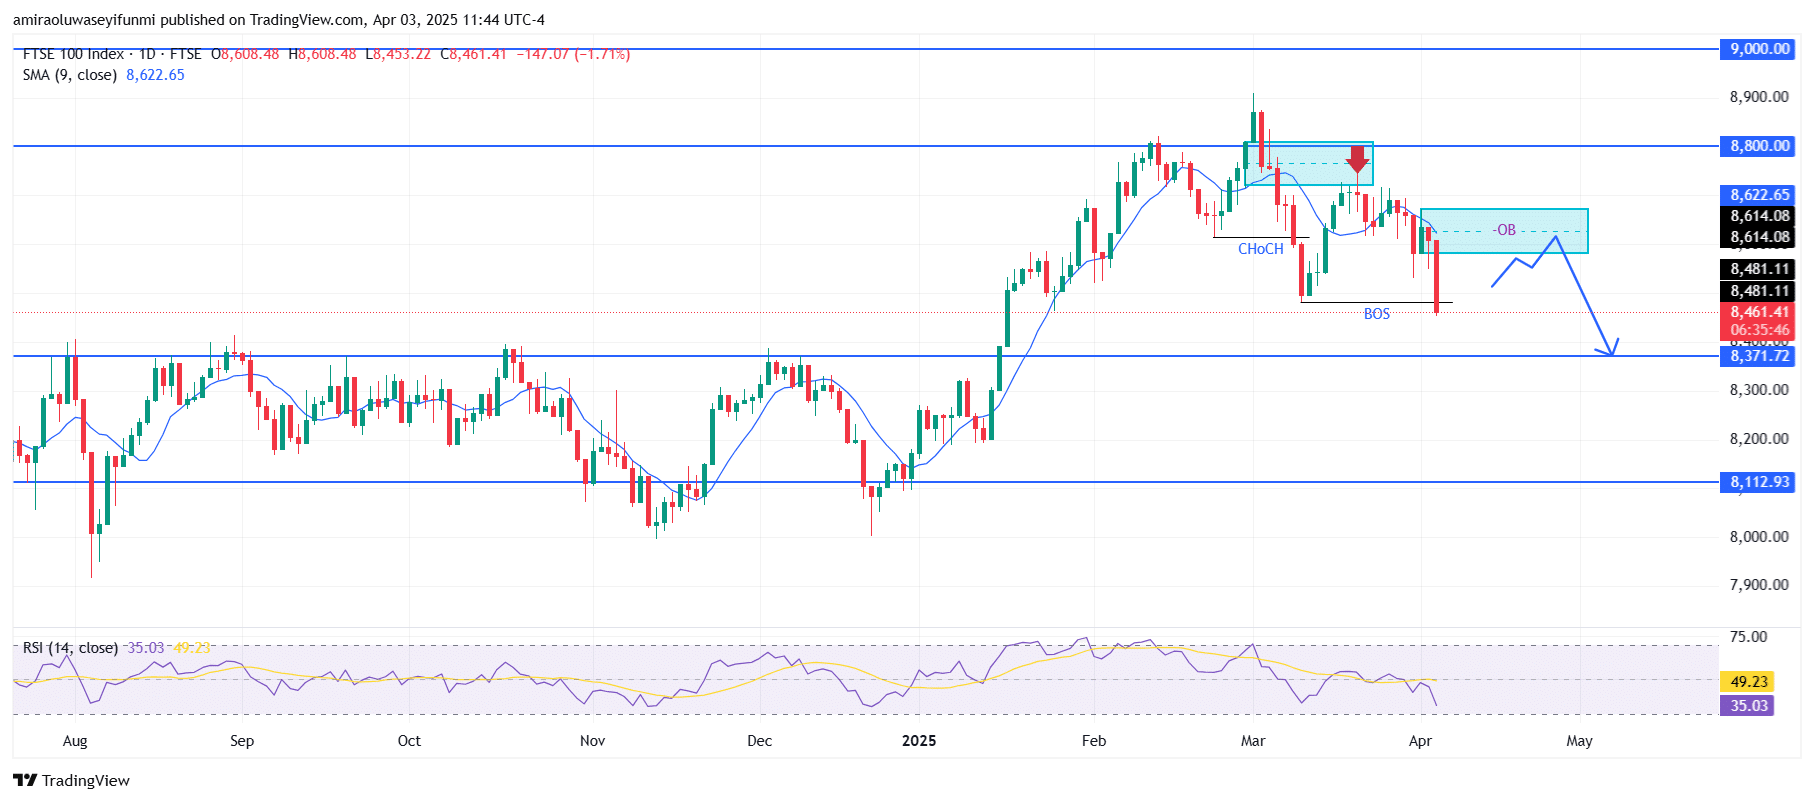
FTSE100 Short-Term Trend: Bearish
FTSE 100 remains in a bearish trend, with the price currently trading below diagonal resistance. The descending trendline continues to exert selling pressure, contributing to the formation of lower highs.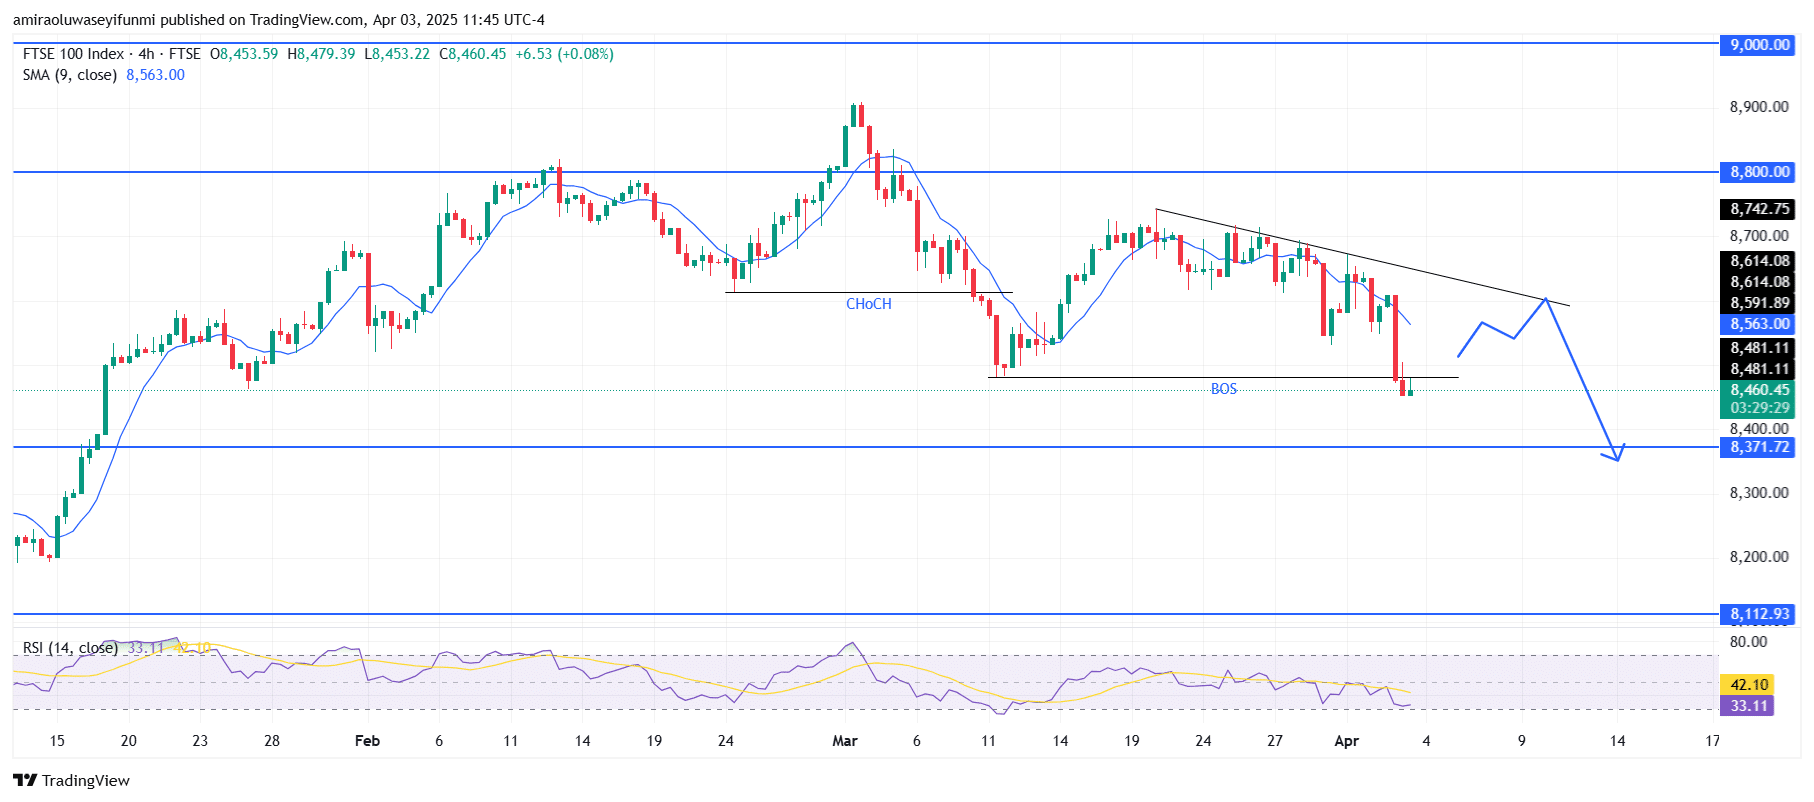
Make money without lifting your fingers: Start using a world-class auto trading solution
How To Buy Lucky Block – Guide, Tips & Insights | Learn 2 Trade
Note: Learn2.trade is not a financial advisor. Do your research before investing your funds in any financial asset, product, or event. We are not responsible for your investment results.
- Broker
- Min Deposit
- Score
- Visit Broker

- Award-winning Cryptocurrency trading platform
- $100 minimum deposit,
- FCA & Cysec regulated

- 20% welcome bonus of upto $10,000
- Minimum deposit $100
- Verify your account before the bonus is credited
- Fund Moneta Markets account with a minimum of $250
- Opt in using the form to claim your 50% deposit bonus
Learn to Trade
Never Miss A Trade Again

Signal Notification
Real-time signal notifications whenever a signal is opened, closes or Updated

Get Alerts
Immediate alerts to your email and mobile phone.

Entry Price Levels
Entry price level for every signal Just choose one of our Top Brokers in the list above to get all this free.