

FTSE 100 Analysis – February 26
FTSE 100 is exhibiting bullish momentum with key levels in focus. The 9-day Simple Moving Average (SMA) at $8,710 serves as immediate support, reinforcing the prevailing bullish trend. The MACD (Moving Average Convergence Divergence) histogram indicates a decline in bearish momentum, with the signal line at 78.90 remaining above the MACD line at 58.50, suggesting the potential for further gains. Additionally, the Relative Strength Index (RSI) above 50 underscores the strength of bullish sentiment, indicating further room for price appreciation.
FTSE 100 Key Levels
Resistance Levels: $8,800, $9,000, $9,200
Support Levels: $8,370, $8,110, $7,790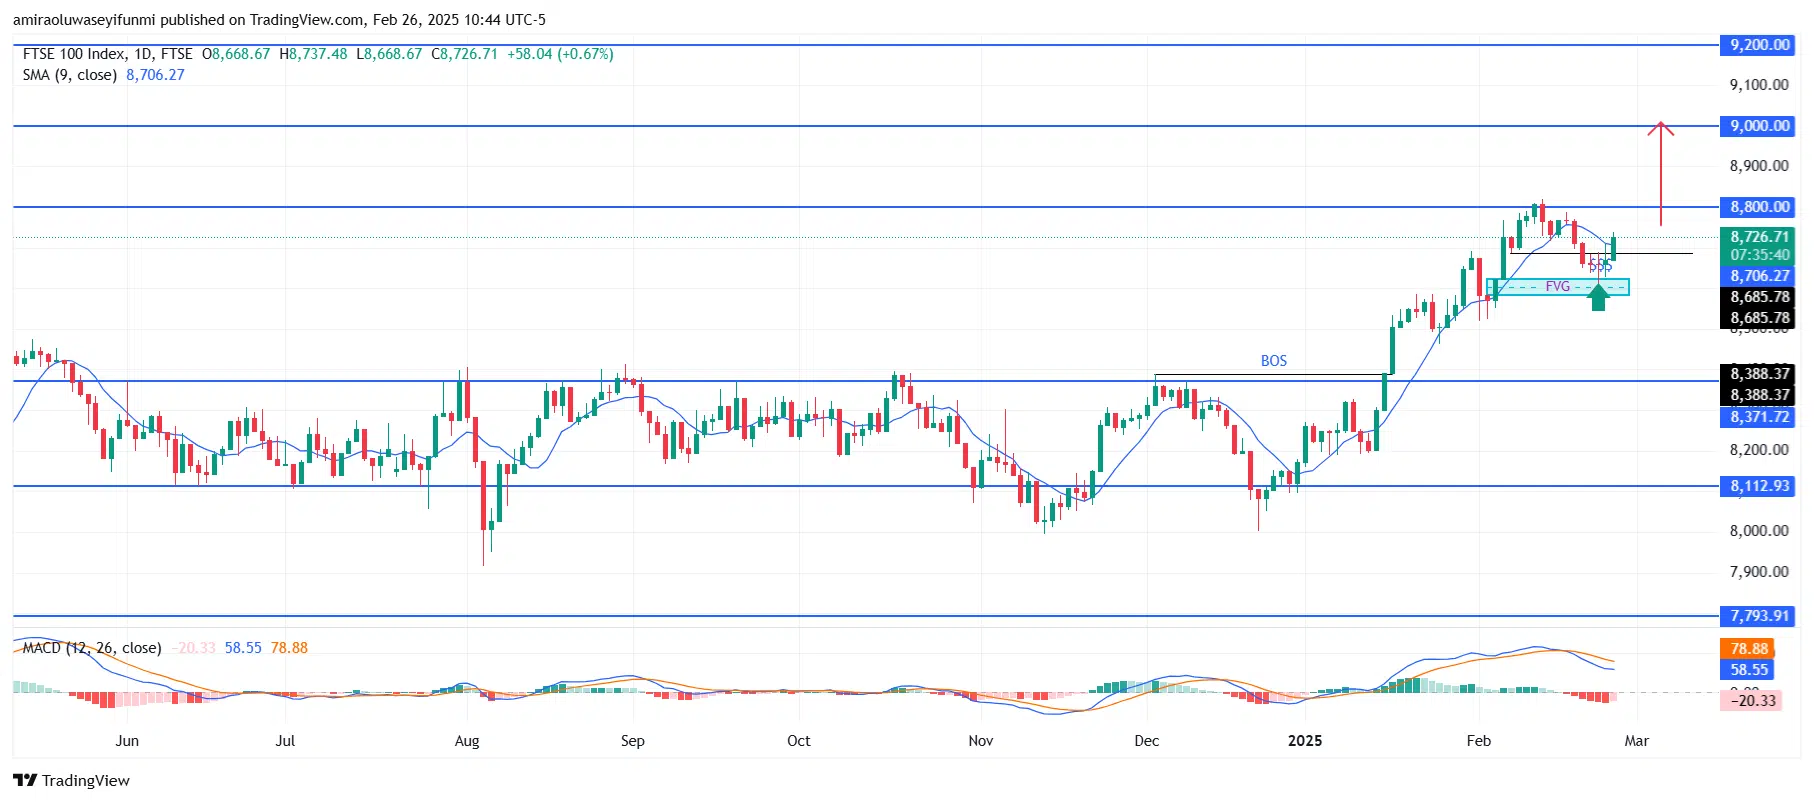
FTSE 100 Long-Term Trend: Bullish
FTSE 100 Short-Term Trend: Bullish
On the 4-hour chart, the FTSE 100 continues to display a bullish bias, trading above the 9-period SMA at $8,680, which serves as dynamic support. Recent price action has shown a rebound from the fair value gap (FVG) around $8,650, coinciding with an ascending trendline and reinforcing bullish momentum.
Make money without lifting your fingers: Start using a world-class auto trading solution
How To Buy Lucky Block
Note: Learn2.trade is not a financial advisor. Do your research before investing your funds in any financial asset, product, or event. We are not responsible for your investment results.


