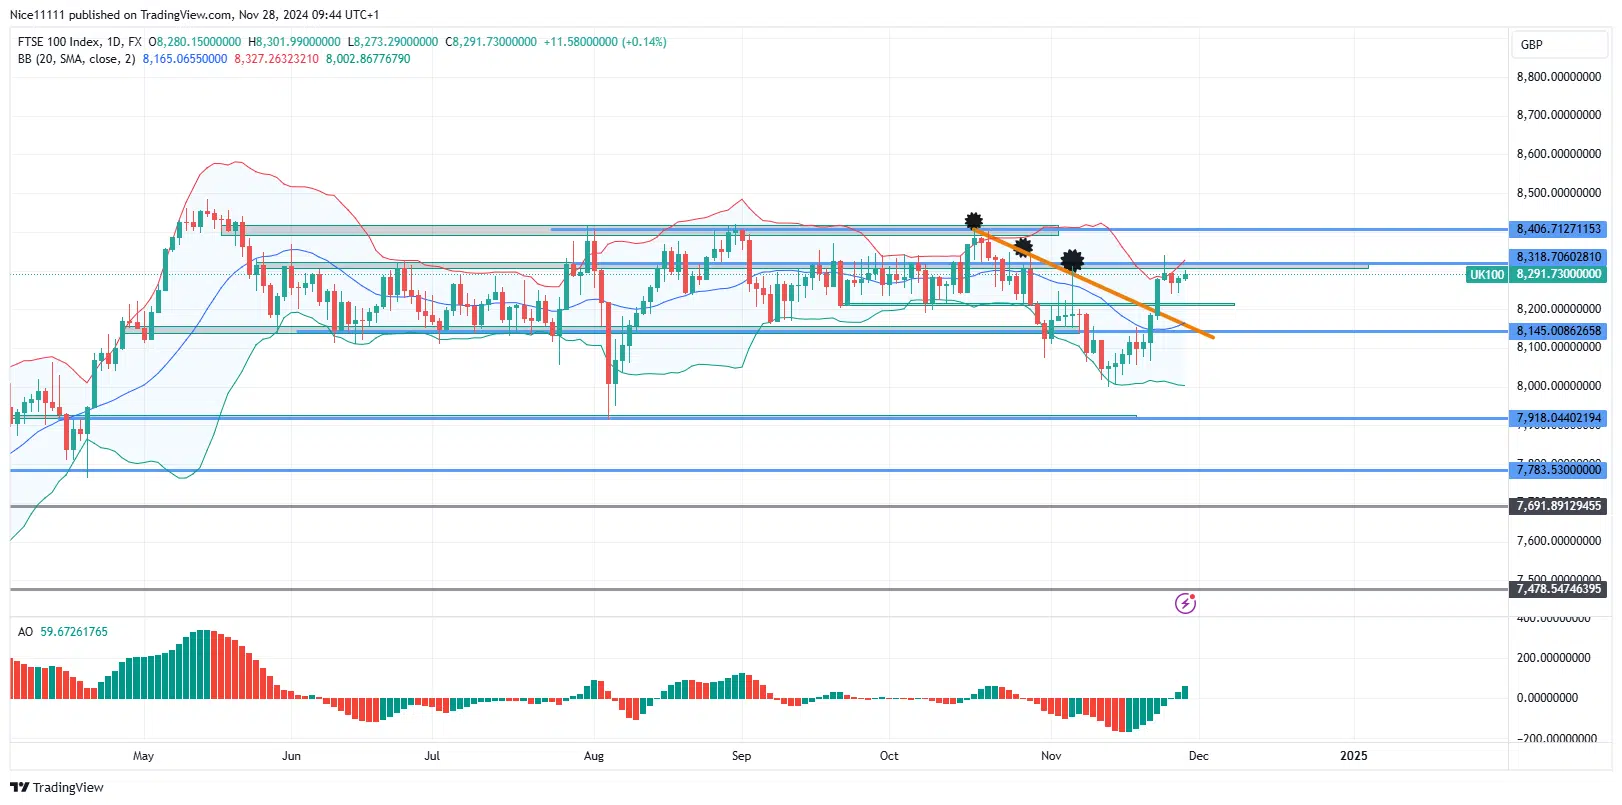
The FTSE 100 recently broke below both minor and major support levels at 8200.0 and 8145.0 on the daily chart. However, the bearish momentum lost steam before reaching the next support at 7918.0. Instead, the price has reversed course, climbing back to the previous resistance zone at 8318.0.
The breakdown below 8145.0 was a pivotal moment, as this level had provided consistent support since May, except for a brief dip in August. During the drop, the Awesome Oscillator highlighted strong bearish momentum, driving the price closer to the 7918.0 support level.
However, the downward move stalled before reaching 7918.0. The price tested the lower Bollinger Band, indicating oversold conditions, which triggered a reversal. The market rebounded above the 8145.0 support, and the price has now broken above a descending trendline on the daily chart, signaling a possible shift toward bullish control.
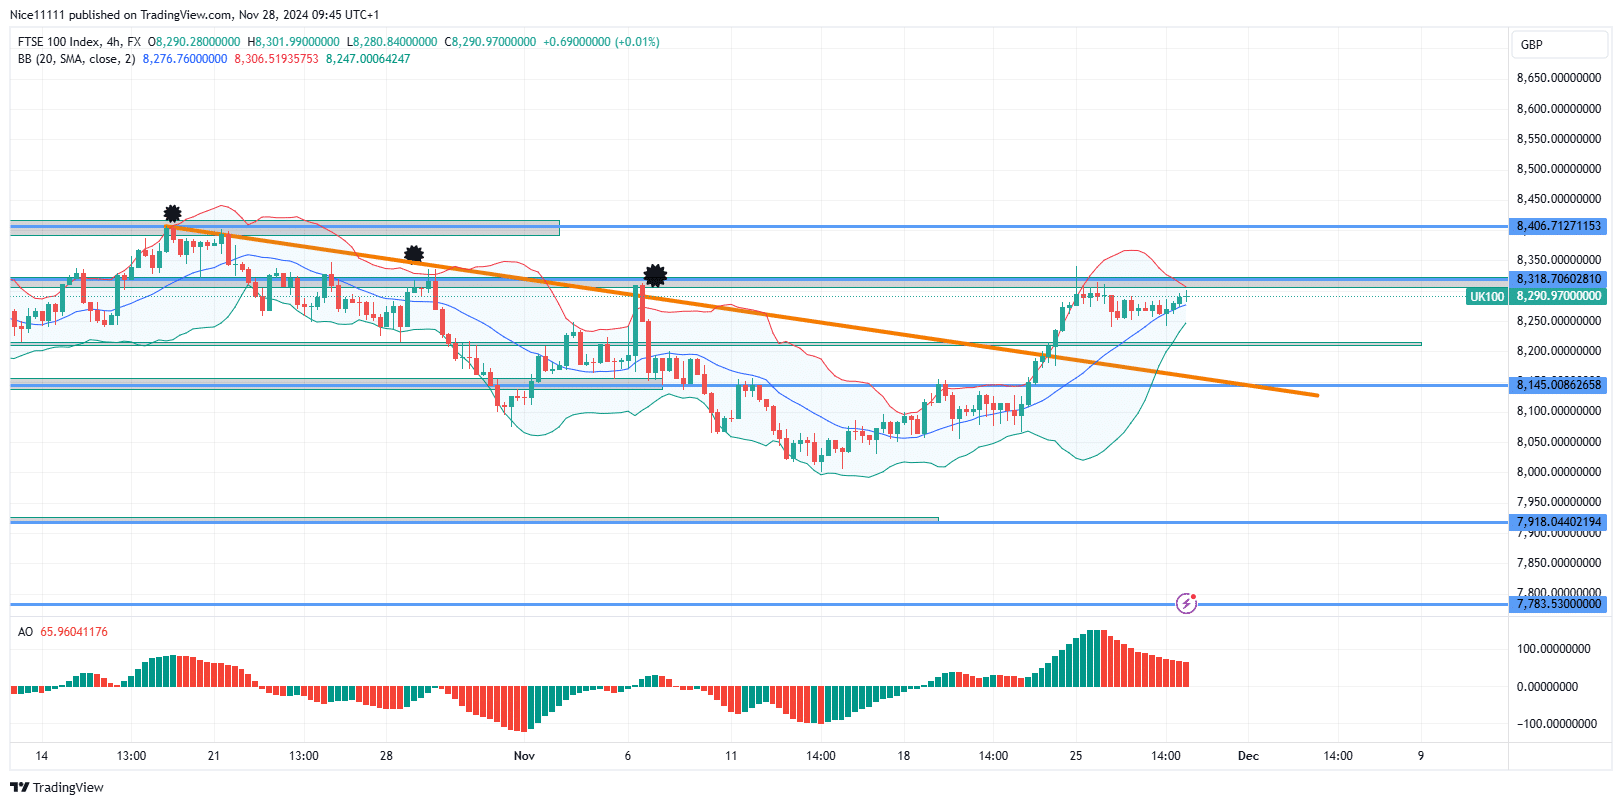
FTSE 100 Short-Term Trend: Bullish
On lower timeframes, the price recovery above 8145.0 demonstrated significant bullish strength, with a series of bullish candles propelling the market toward the 8318.0 resistance zone. Despite reaching this critical level, the Awesome Oscillator shows waning bullish momentum. Buyers are actively challenging the 8318.0 resistance, aiming to secure a breakout and extend the bullish rally.
The FTSE 100 is at a decisive point, with bulls contending with resistance at 8318.0. A breakout could set the stage for continued upward movement, while failure to breach this level may invite renewed selling pressure. Traders are closely monitoring forex signals for insights on the market’s next move.
Note: Learn2.trade is not a financial advisor. Do your research before investing your funds in any financial asset, product, or event. We are not responsible for your investment results.
Trade on MT4 with Leverage up to 1:500! Trade on MT4 with Leverage up to 1:500!
X
We use cookies to ensure that we give you the best experience on our website. If you continue to use this site we will assume that you are happy with it.