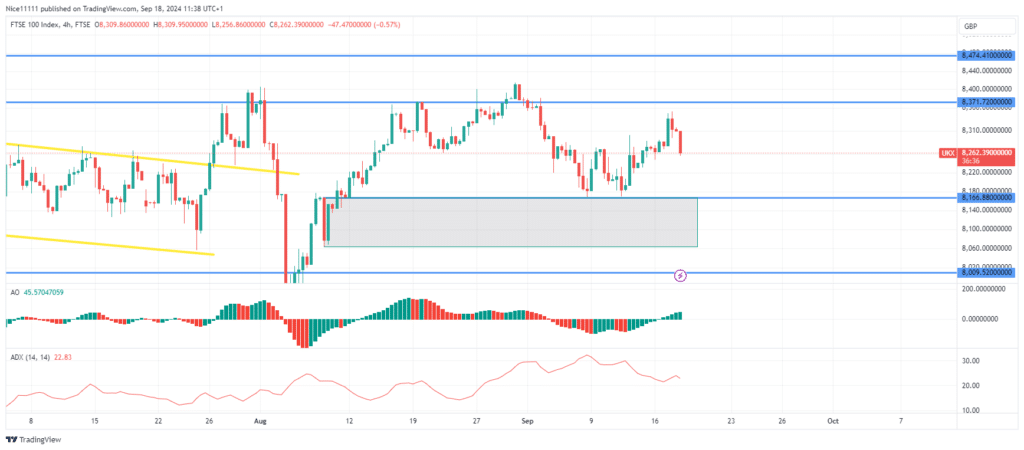
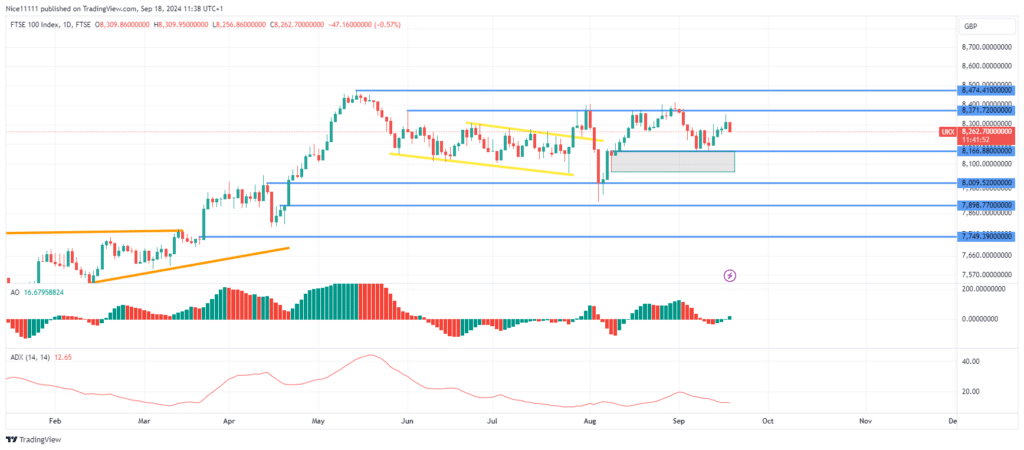
The FTSE 100 index has struggled to break above the resistance level of 8,371.720. Each rejection from this resistance zone has driven the price down to the bullish order block at 8,167.0.
After five unsuccessful attempts to break the 8,371.0 resistance, FTSE 100 index remains trapped below this level, moving sideways and forming a range just under the key zone.
The Awesome Oscillator has displayed small bars for two consecutive weeks, reflecting a significant lack of volatility as the price remains below the resistance. Similarly, the Average Directional Index (ADX) reading has dropped below 20, indicating a lack of trend on the daily chart.
FTSE 100 Short-term Trend: Bullish
A recent test of the bullish order block at 8,167.0 resulted in the formation of a double bottom, initiating a bullish trend on the 4-hour chart. Forex signals points that market is gradually approaching the 8,372.0 resistance level for another attempt to break higher.
Note: Learn2.trade is not a financial advisor. Do your research before investing your funds in any financial asset, product, or event. We are not responsible for your investment results.
Trade on MT4 with Leverage up to 1:500! Trade on MT4 with Leverage up to 1:500!
X
We use cookies to ensure that we give you the best experience on our website. If you continue to use this site we will assume that you are happy with it.