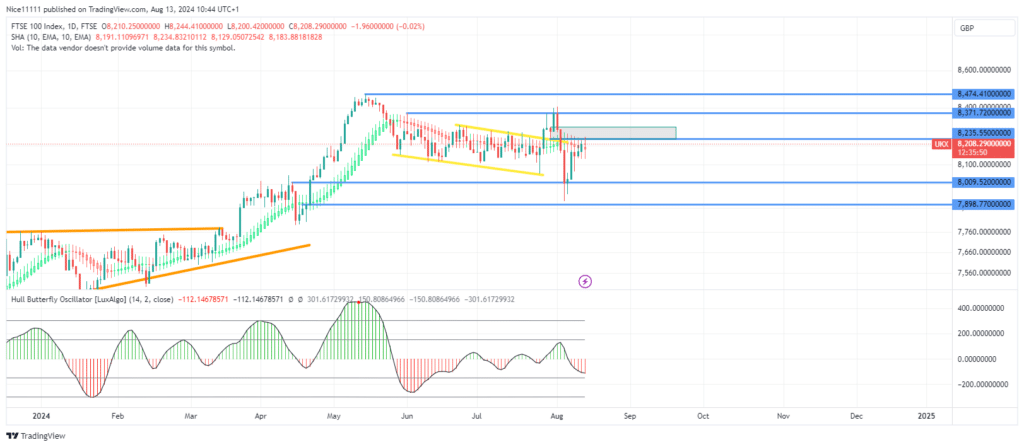
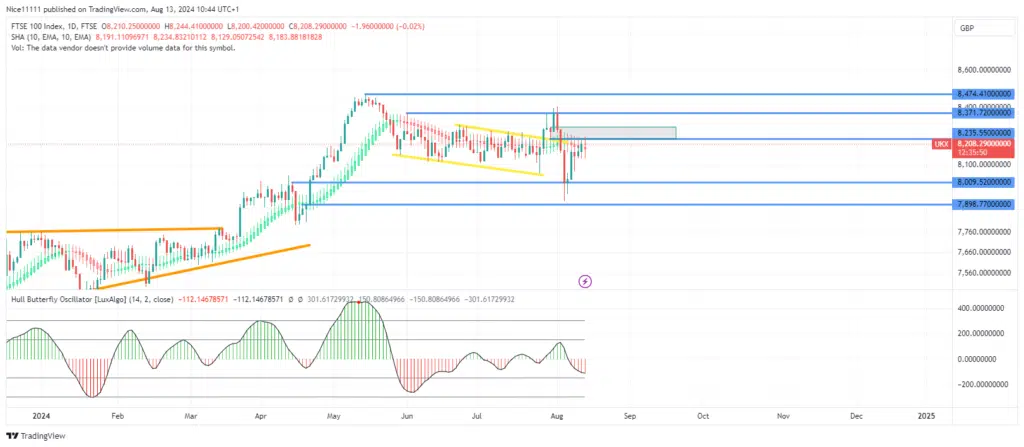
The FTSE 100 index recently encountered a bearish mitigation block following a false breakout above a bullish channel in late July. After this breakout, a retest of the channel in early August led to a new high, but the price subsequently experienced a significant decline. This drop was driven by a Judas swing, which misled traders and targeted liquidity at the swing high of 8371.0. The price has now retraced to the mitigation block that preceded this decline.
The bearish trend has been confirmed by the formation of three black crows, pushing the price into a region of market inefficiency below 8010.0. This area, marked by a Fair Value Gap just below 8010.0, highlights market inefficiency. The sharp dip in price suggests a move towards market efficiency, with the decline halting as it reached this zone.
A bullish retracement began after the Fair Value Gap was closed, yet the Hull Butterfly indicator continues to signal a bearish market. Additionally, the Smoothed Heikin Ashi candles are acting as resistance, with the price pausing upon reaching these levels. The bearish mitigation block is also resisting the price ascent, indicating potential for continued downside pressure.
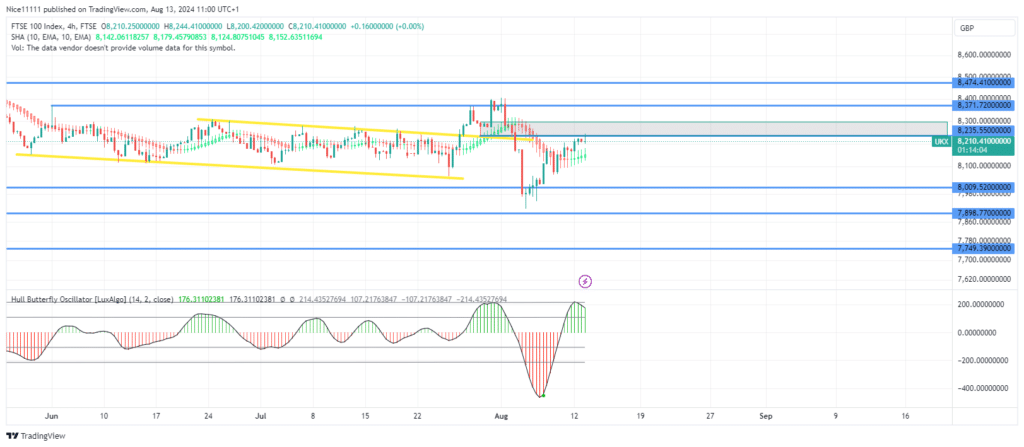
FTSE 100 Short-Term Trend
On the daily chart, the recent pullback resembles an upward trend on the 4-hour chart. A shift in market structure on the lower timeframe is anticipated to confirm a price reversal, potentially sustaining the bearish trend. This reversal could align with forex signals, suggesting traders remain cautious of potential bearish continuation.
Note: Learn2.trade is not a financial advisor. Do your research before investing your funds in any financial asset, product, or event. We are not responsible for your investment results.
Trade on MT4 with Leverage up to 1:500! Trade on MT4 with Leverage up to 1:500!
X
We use cookies to ensure that we give you the best experience on our website. If you continue to use this site we will assume that you are happy with it.