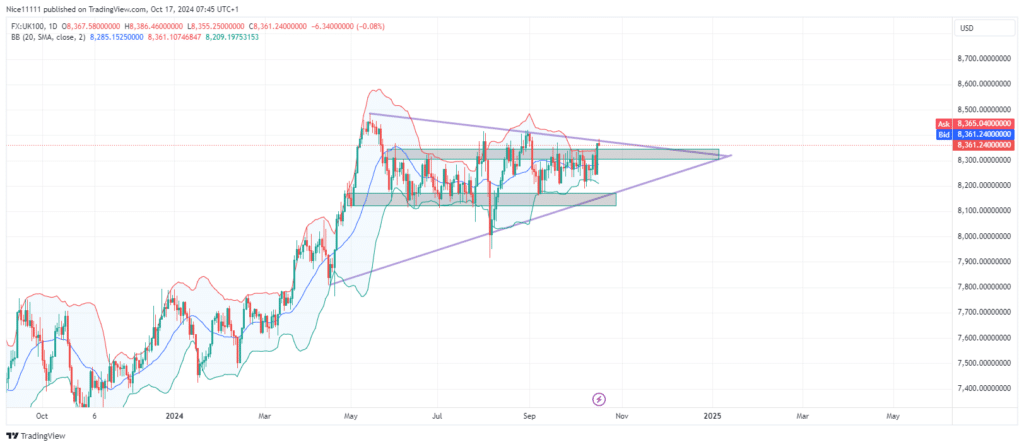
The FTSE 100 index is currently without a clear directional trend, as daily candlesticks fluctuate within established support and resistance zones. The price action shows a sideways movement, evident in the symmetrical triangle pattern, highlighting the progressively tightening range.
The FTSE 100’s price action has become increasingly erratic after six months of market consolidation. This prolonged period of uncertainty has created a challenging trading environment, as price movements lack a defined direction. The random swing highs and lows complicate holding positions without encountering frequent stop-outs.
The consistent interaction with both the upper and lower Bollinger Bands further indicates the sideways momentum. In a stronger directional trend, the price typically sticks to one side of the Bollinger Bands. However, the frequent testing of both sides in the FTSE 100 index suggests a lack of momentum in either direction, thereby needing a clear forex signal for traders.
FTSE 100 Short-term Trend: Ranging
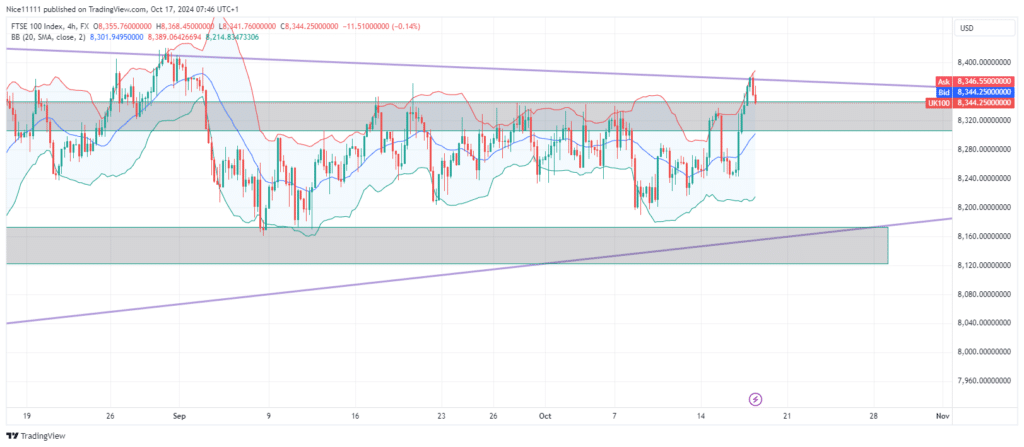
On lower timeframes, a recent double break of structure to the upside has been observed. This, however, may be misleading, as sudden reversals remain possible given the ongoing consolidation on higher timeframes. Following the principle of “The trend is your friend,” it is generally safer to trade when price direction consistently aligns across both higher and lower timeframes. In this scenario, the absence of a cohesive trend across timeframes makes the market difficult to navigate.
Note: Learn2.trade is not a financial advisor. Do your research before investing your funds in any financial asset, product, or event. We are not responsible for your investment results.
Trade on MT4 with Leverage up to 1:500! Trade on MT4 with Leverage up to 1:500!
X
We use cookies to ensure that we give you the best experience on our website. If you continue to use this site we will assume that you are happy with it.