FTSE 100 Analysis – December 31
FTSE 100 maintains upward structure supported by persistent demand. The FTSE 100 Market continues to display a constructive directional bias, with price holding comfortably above the short-term moving average around $9,880. Market structure remains well organized, marked by successive higher swing points that reflect steady capital inflows rather than speculative momentum. Momentum indicators support this outlook, as the MACD remains above its equilibrium line while the histogram shows gradual improvement, signaling stable and internally balanced buying interest.
FTSE 100 Key Levels
Supply Levels: $9900.0, $10100.0, $10,400.0
Demand Levels: $9700.0, $9350.0, $8900.0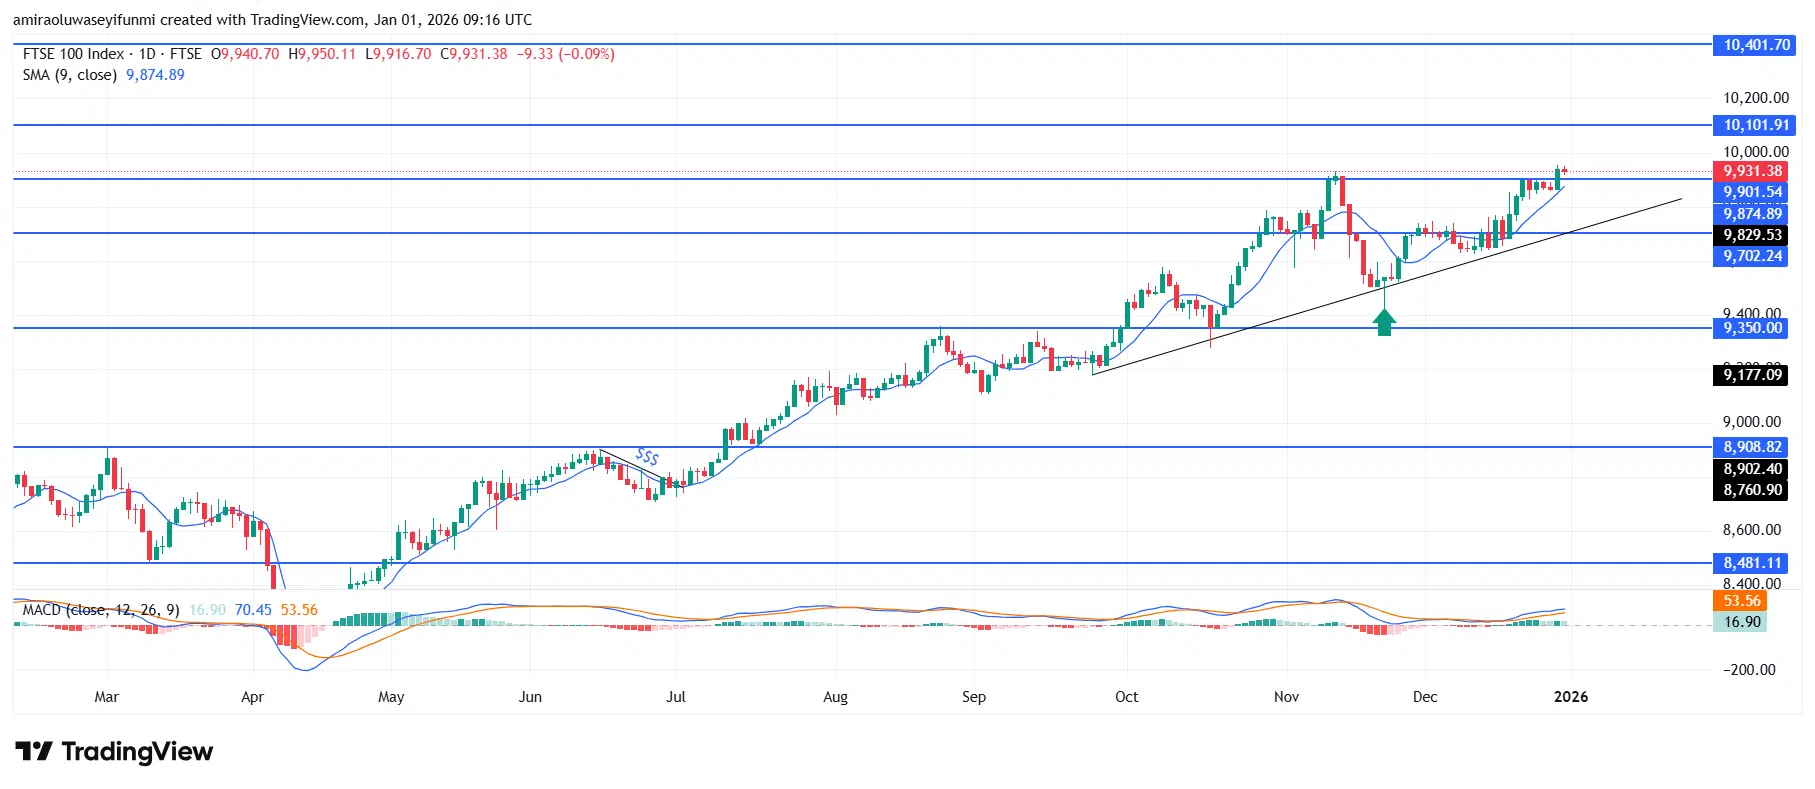
FTSE100 Long-Term Trend: Bullish
From a technical perspective, price action continues to respect a rising support path currently aligned between $9,850 and $9,880. Recent pullbacks have lacked downside momentum, stabilizing quickly above the $9,900 region, which has effectively transitioned from a former supply zone into a demand reference. Repeated interaction with the $9,980–$10,000 range points to absorption rather than rejection, suggesting the market is building strength below a key psychological level while volatility remains controlled.
Looking ahead, the FTSE 100 Market retains potential for further upside as long as daily closes hold above $9,850. A sustained break beyond $10,000 would likely shift attention toward $10,100 initially, with scope for extension toward $10,400 if participation expands. Any near-term retracement toward $9,900 or $9,820 is expected to be rotational, reinforcing the broader bullish structure rather than weakening it.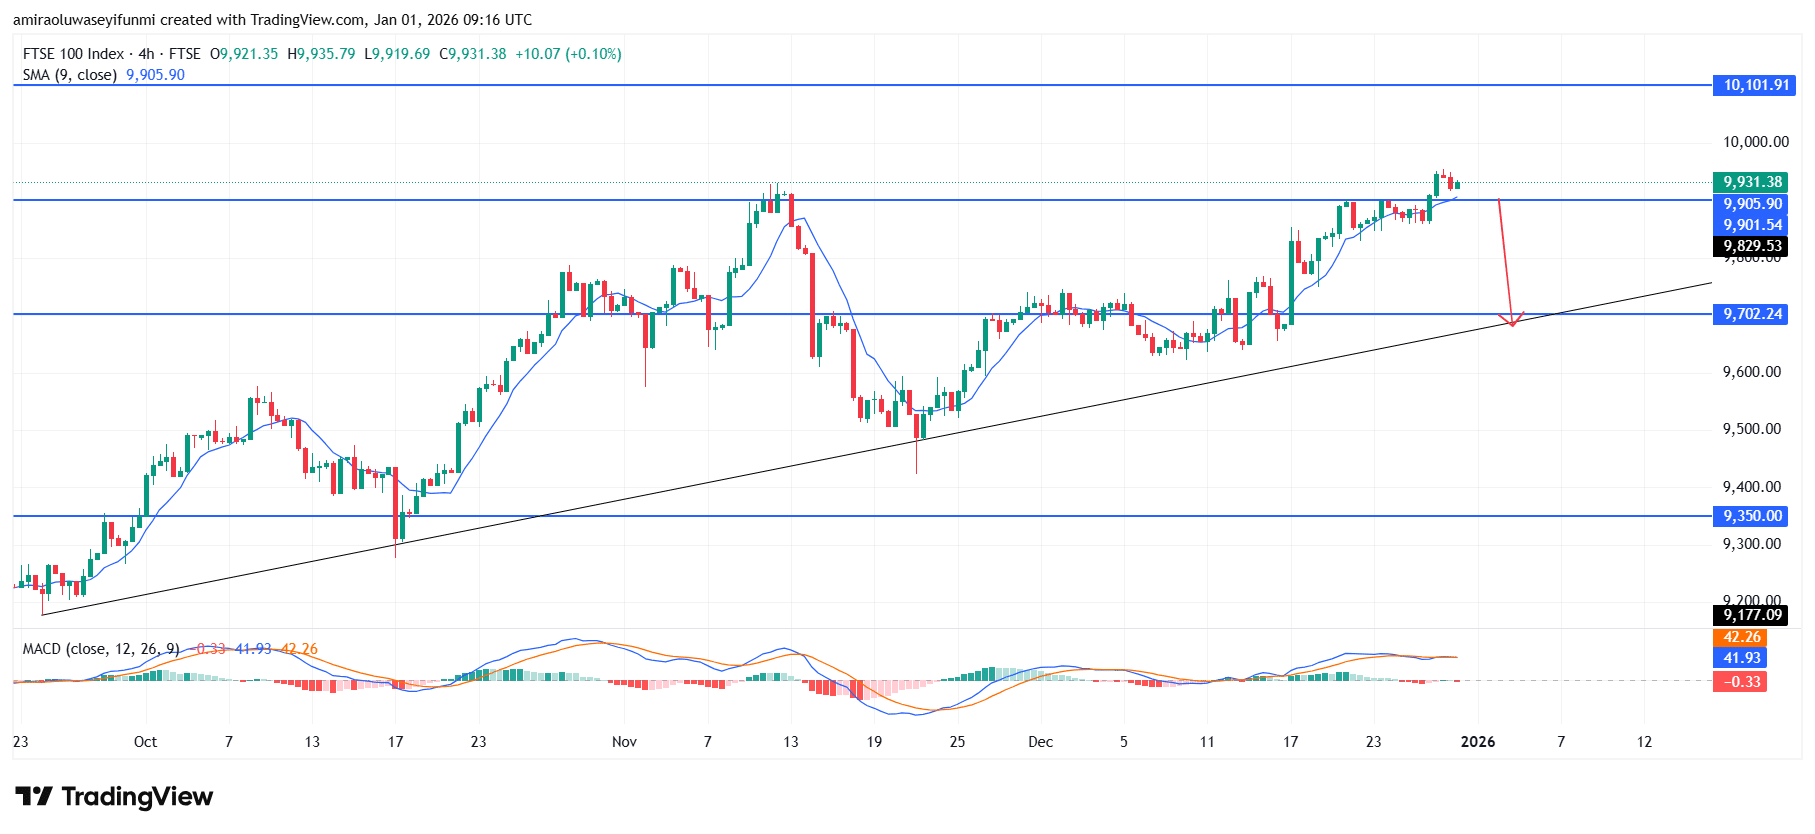
FTSE100 Short-Term Trend: Bearish
FTSE 100 is showing early signs of short-term fatigue on the four-hour chart as price consolidates below the $9,940–$9,960 resistance zone while momentum indicators flatten. The index is trading slightly above its rising trendline, but rejection wicks near $9,930 indicate increasing seller activity at elevated levels, a dynamic often tracked through forex signals for confirmation of a corrective phase.
A pullback toward the $9,700 area would align with trendline support and prior demand, keeping the broader structure intact. If $9,700 fails to hold, downside pressure could extend toward $9,600 before buyers regain control.
Make money without lifting your fingers: Start using a world-class auto trading solution
How To Buy Lucky Block
Note: Learn2.trade is not a financial advisor. Do your research before investing your funds in any financial asset, product, or event. We are not responsible for your investment results.
- Broker
- Min Deposit
- Score
- Visit Broker

- Award-winning Cryptocurrency trading platform
- $100 minimum deposit,
- FCA & Cysec regulated

- 20% welcome bonus of upto $10,000
- Minimum deposit $100
- Verify your account before the bonus is credited
- Fund Moneta Markets account with a minimum of $250
- Opt in using the form to claim your 50% deposit bonus
Learn to Trade
Never Miss A Trade Again

Signal Notification
Real-time signal notifications whenever a signal is opened, closes or Updated

Get Alerts
Immediate alerts to your email and mobile phone.

Entry Price Levels
Entry price level for every signal Just choose one of our Top Brokers in the list above to get all this free.