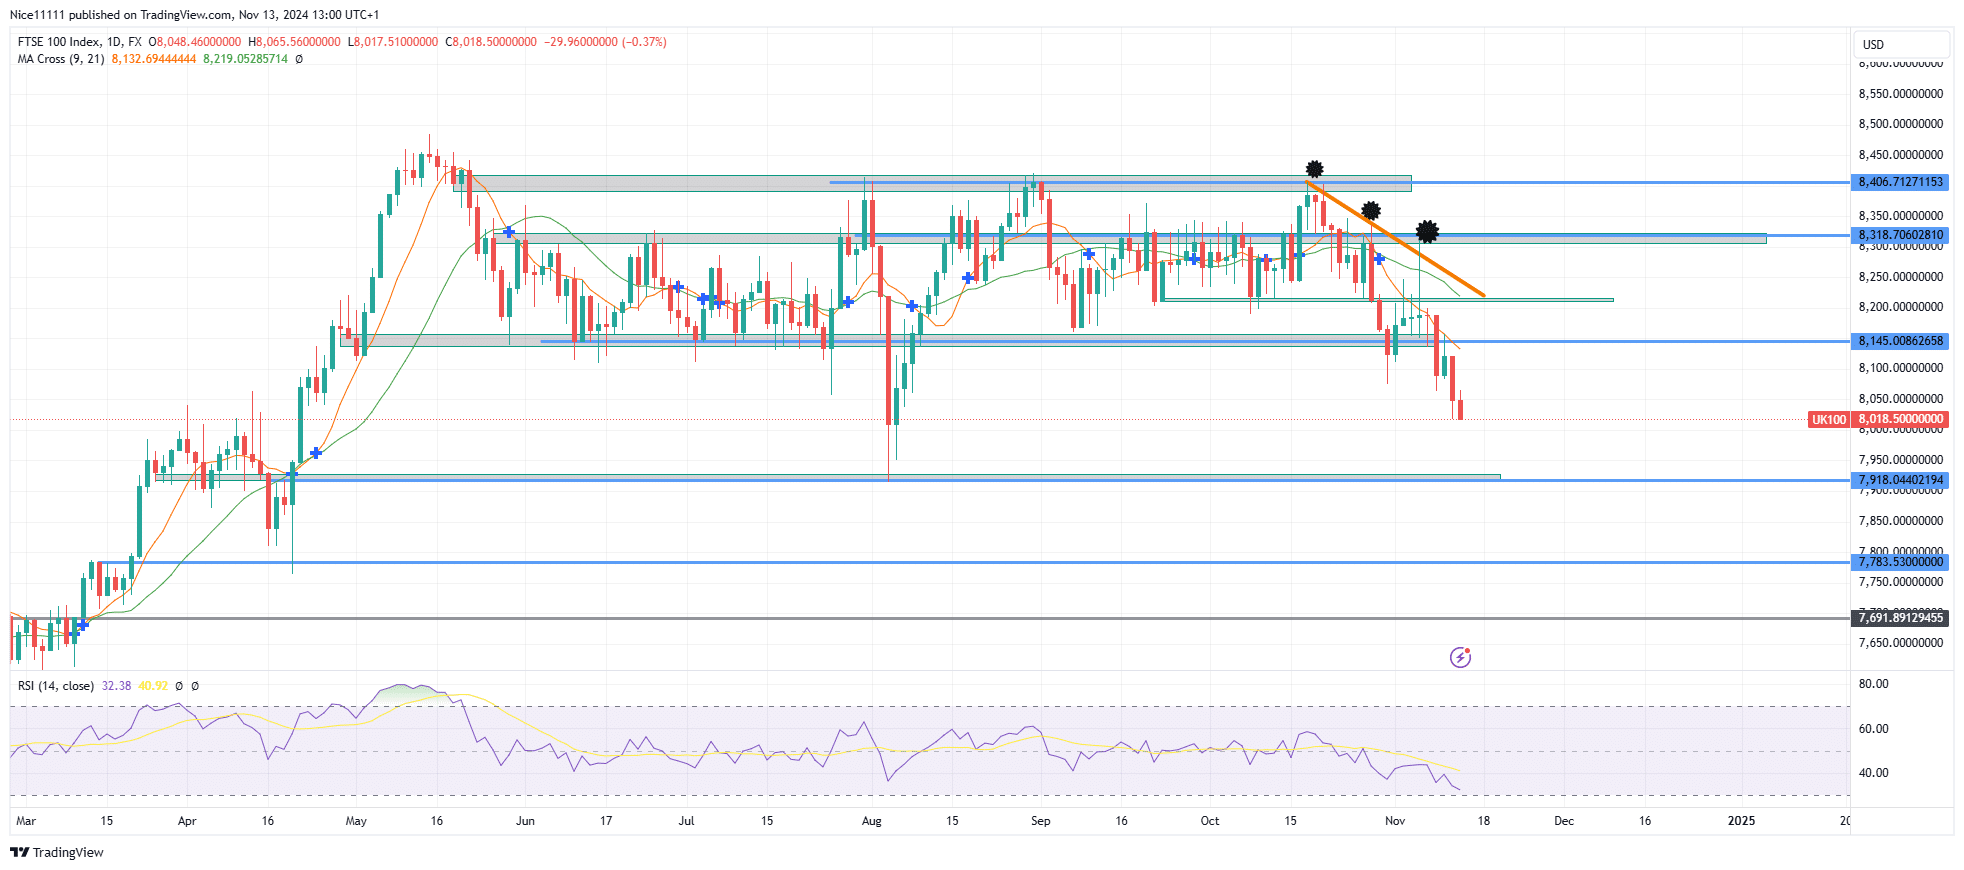
The FTSE 100 recently broke below the critical 8145.0 level on the daily chart. Following this breach, the index retraced to the 8318.0 resistance level, where sellers quickly capitalized, initiating significant shorting that pushed the price sharply downward toward 7918.0. With the index approaching critical demand zones, further downside movement appears likely.
Between June and October, the Relative Strength Index (RSI) hovered consistently around 50, indicating a prolonged phase of consolidation. During this time, the market lacked clear momentum, neither reaching overbought nor oversold conditions.
However, sentiment shifted dramatically in late October when the FTSE 100 tested the 8406.0 supply zone. This test marked the beginning of a bearish reversal, leading to a decisive break below the 8145.0 support level. Afterward, the index briefly retraced to the 8318.0 order block, where sellers heavily shorted, reinforcing the bearish trend. A pronounced shooting star candle confirmed the downward momentum, accelerating the decline.
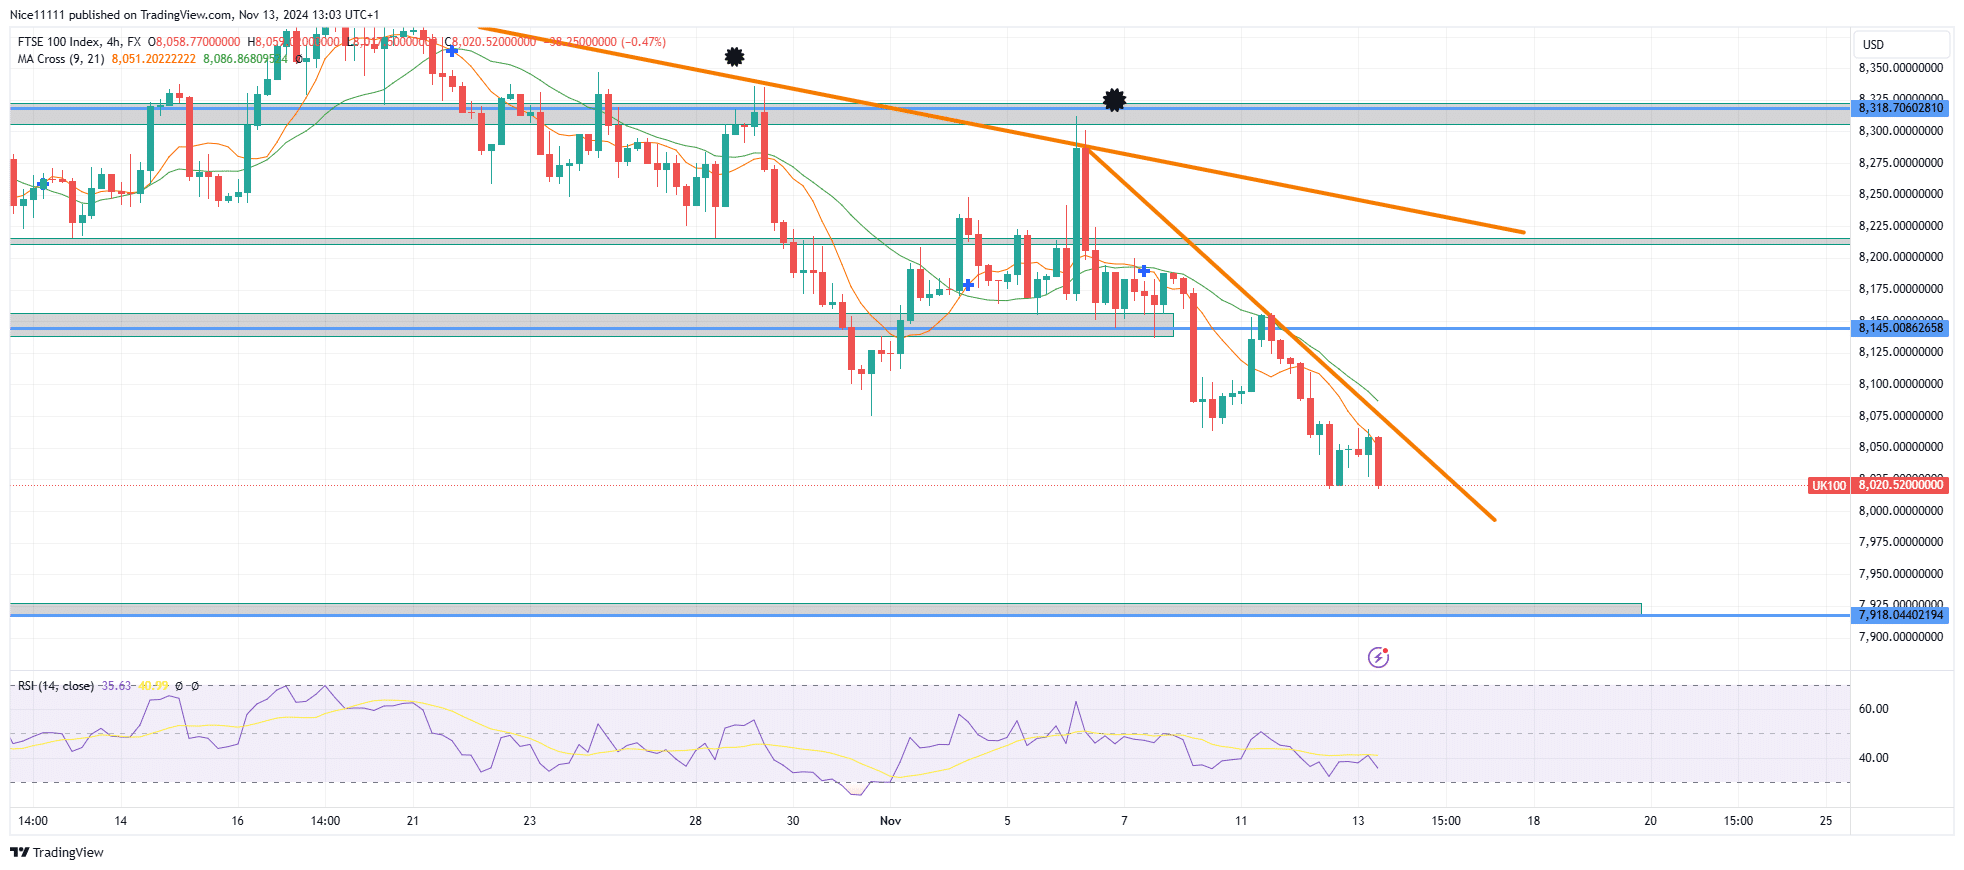
FTSE 100 Short-Term Trend: Bearish
In the short term, the outlook remains firmly bearish. On the 4-hour chart, a clear micro downtrend is in progress, as evidenced by a descending resistance trendline. Price action continues to trend lower, with 7918.0 emerging as the next significant target. Traders monitoring forex signals can use these levels to anticipate potential market movements and adjust their strategies accordingly.
Note: Learn2.trade is not a financial advisor. Do your research before investing your funds in any financial asset, product, or event. We are not responsible for your investment results.
Trade on MT4 with Leverage up to 1:500! Trade on MT4 with Leverage up to 1:500!
X
We use cookies to ensure that we give you the best experience on our website. If you continue to use this site we will assume that you are happy with it.