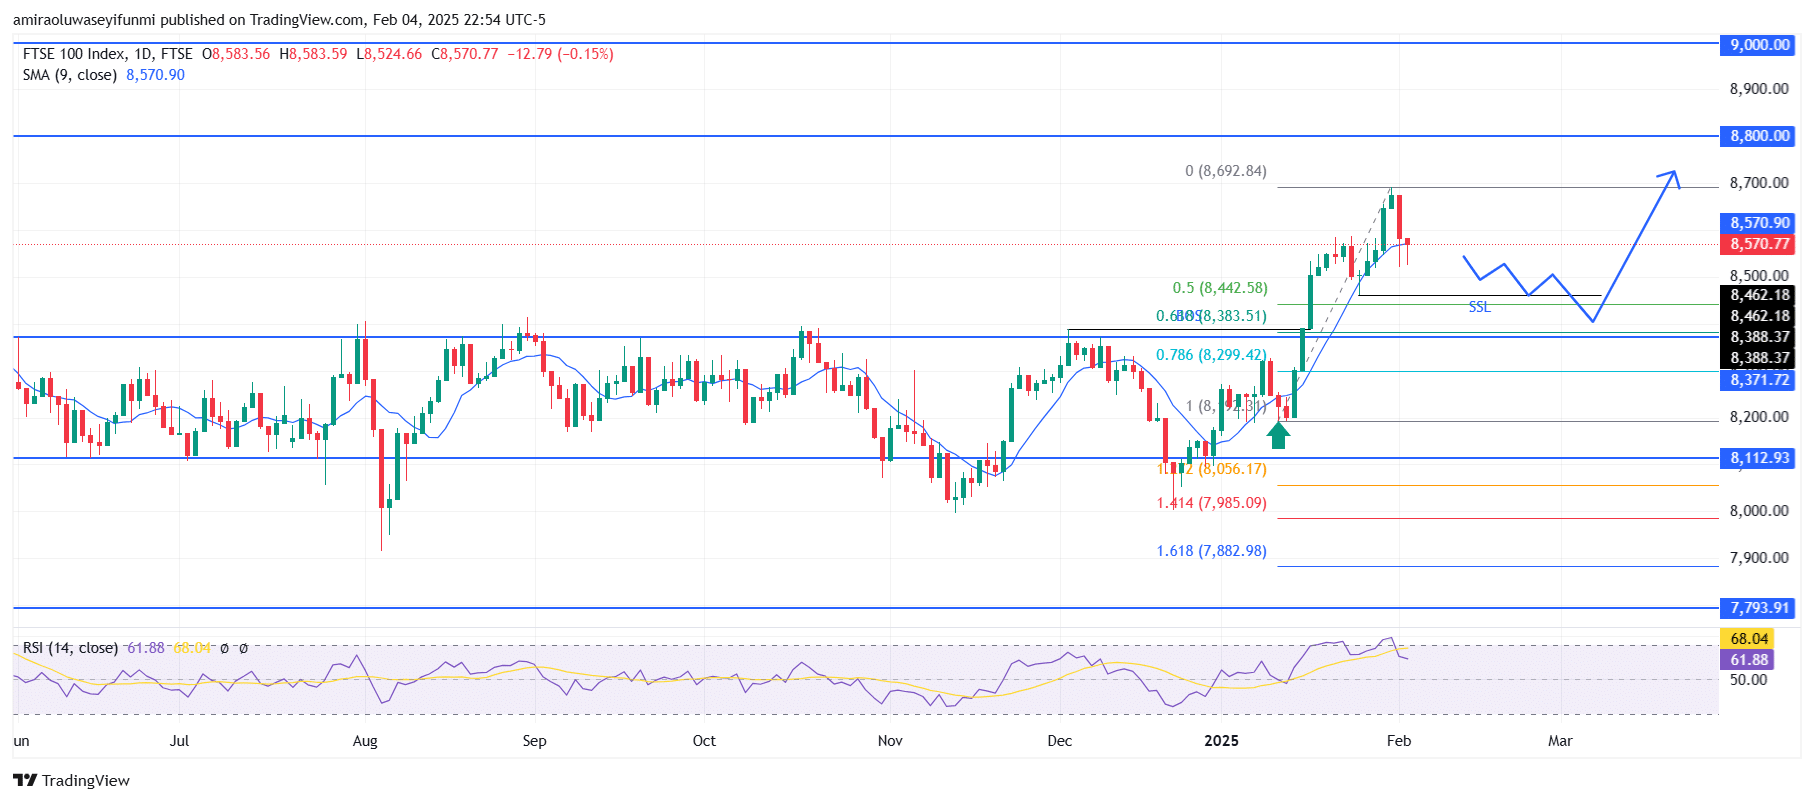
FTSE 100 is continuing its bullish rally with $8,800 in sight. The index is supported by positive technical indicators, including the 9-day Simple Moving Average (SMA) positioned at $8,570, which acts as a dynamic support level in line with the current trading price. The Relative Strength Index (RSI) stands at 62, reflecting bullish momentum without reaching overbought territory, with potential resistance identified around 68. Additionally, Fibonacci retracement levels highlight significant support zones at $8,440 (0.5 level) and $8,380 (0.618 level), reinforcing the strength of the ongoing uptrend.
FTSE 100 Key Levels
Resistance Levels: $8,700, $8,800, $9,000 Support Levels: $8,370, $8,110, $7,790
FTSE 100 Long-Term Trend: Bullish
The index recently surpassed the $8,370 resistance level and is poised for a potential retest of that breakout zone. Before this move, the market experienced a period of horizontal consolidation, followed by a significant bullish breakout, indicating strong buying interest. The recent rejection near the $8,690 high suggests some profit-taking activity; however, the formation of higher highs and higher lows reinforces the bullish trend. Currently, the price is showing signs of a downward retracement.
Looking ahead, the FTSE 100 is expected to maintain its bullish momentum following a brief short-term pullback. If the price stabilizes above the $8,370 support level, consolidation may occur before targeting the next resistance at $8,800. A breakout above this level could lead to a move toward the psychological threshold of $9,000. Conversely, if market momentum weakens, a retracement to $8,370 or even $8,110 may occur before the upward trend resumes.
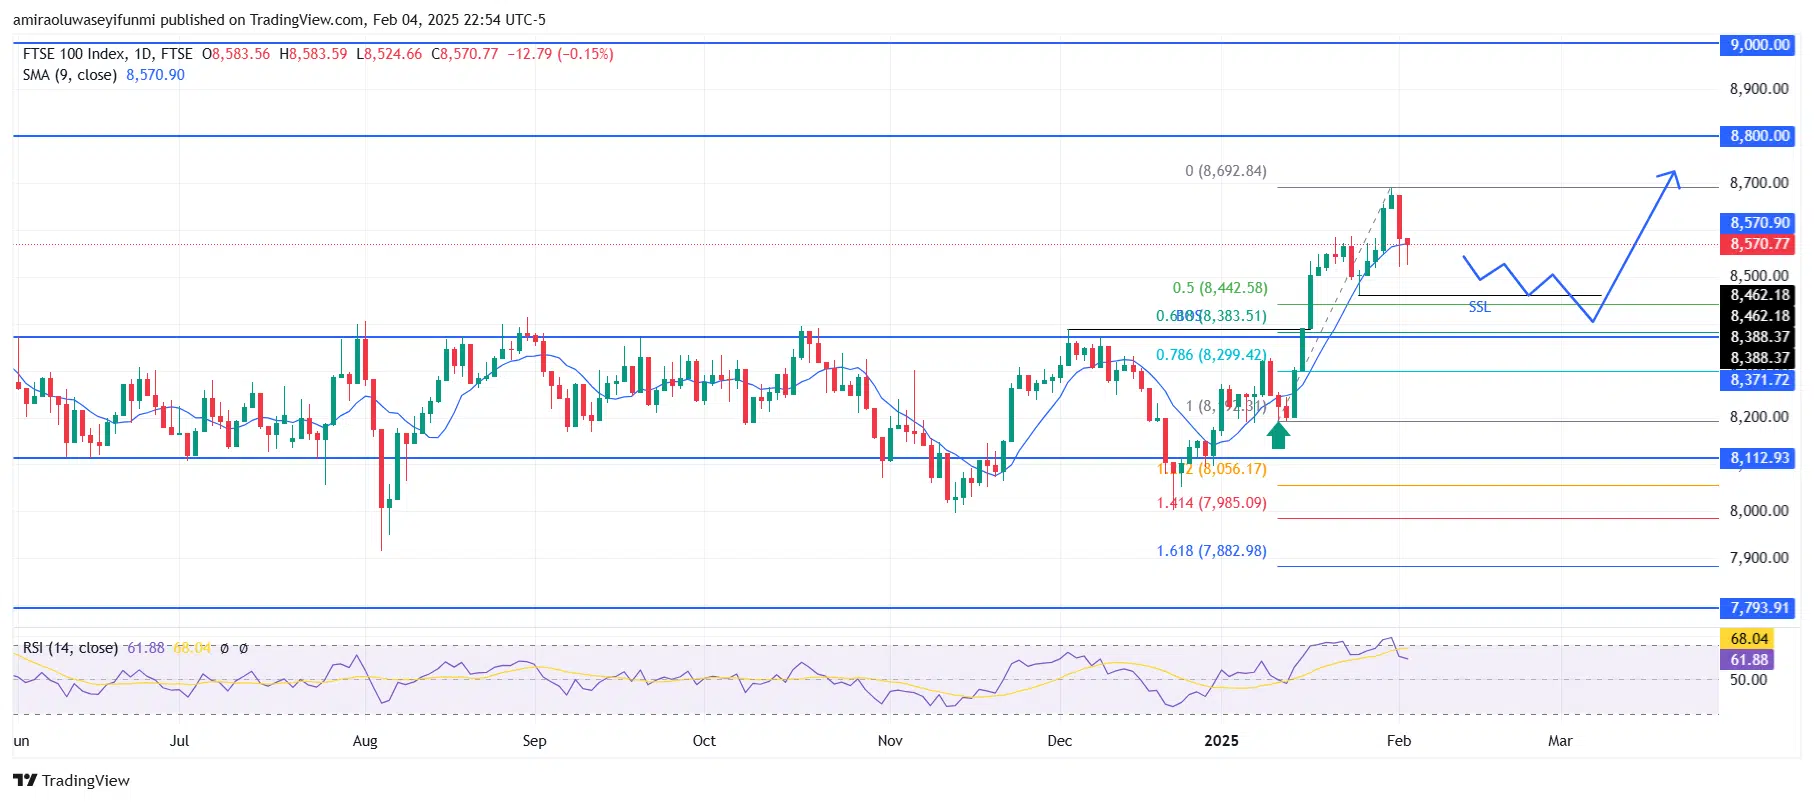
FTSE 100 Short-Term Trend: Bearish
The FTSE 100 is showing bearish signs as the index struggles to hold above the $8,500 mark. The 9-day Simple Moving Average (SMA) at $8,600 now serves as a resistance level. The Relative Strength Index (RSI) stands at 62, suggesting a possible shift in market momentum. A decline below the $8,460 threshold could trigger additional selling pressure toward the support level at $8,370. If bearish momentum persists, key downside targets include $8,110 and, in a more significant downturn, possibly $7,790. Traders seeking forex signals may also find insights in broader market trends.
Note: Learn2.trade is not a financial advisor. Do your research before investing your funds in any financial asset, product, or event. We are not responsible for your investment results.
Trade on MT4 with Leverage up to 1:500! Trade on MT4 with Leverage up to 1:500!
X
We use cookies to ensure that we give you the best experience on our website. If you continue to use this site we will assume that you are happy with it.