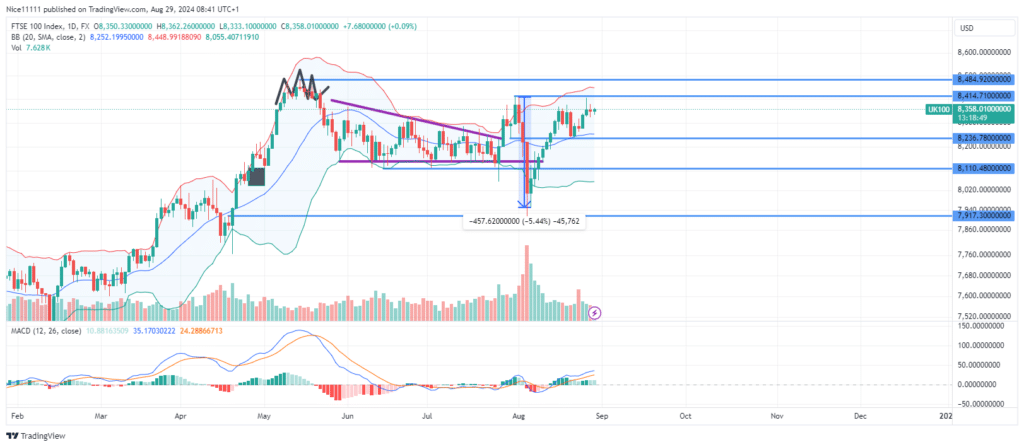
The FTSE 100 index, in August, experienced a sharp and volatile price crash. Within just three days, the market plunged nearly 6%, reflecting intense selling pressure. However, the market has since rebounded, forming a bullish market structure as it now targets the swing high that initially triggered the downturn, offering promising forex signals for traders.
The index price crash in early August was marked by the formation of three consecutive large red candles, often referred to as “three black crows,” highlighting the intensity of the selling momentum. A sudden spike in the volume indicator revealed significant shorting by large market participants, signaling a calculated move. The price dip abruptly halted at a bullish order block around 7,922.0, confirming strong demand in that area.
Since then, the market has formed a higher high and higher low, indicating a clear bullish ascent. This upward movement now threatens the swing high of 8,415.0, suggesting a potential bullish break of structure and more forex signals for market participants.
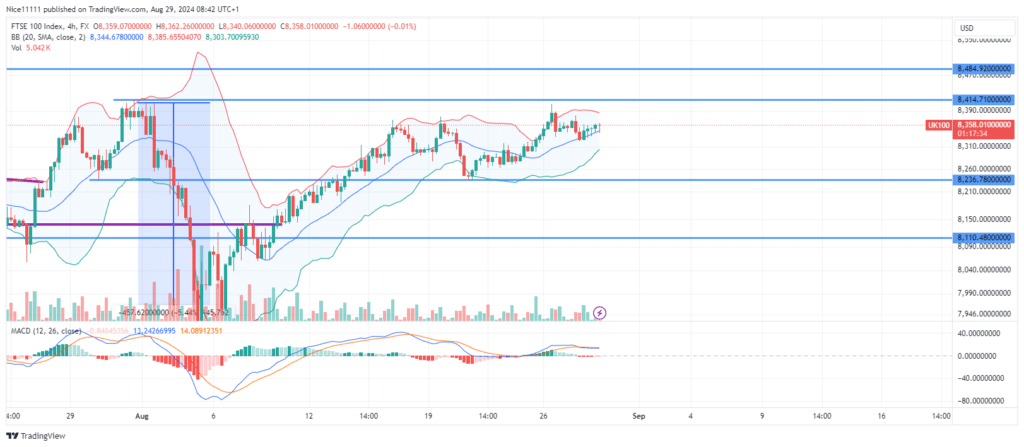
FTSE Short-Term Trend: Bullish
In the short term, the price has retraced to a bullish order block on the four-hour chart, where it found support. The moving average is also providing additional support, reinforcing the bullish outlook. As the price fluctuates, a breakout above the swing high of 8,415.0 is anticipated, which could trigger further upward momentum.
Note: Learn2.trade is not a financial advisor. Do your research before investing your funds in any financial asset, product, or event. We are not responsible for your investment results.
Trade on MT4 with Leverage up to 1:500! Trade on MT4 with Leverage up to 1:500!
X
We use cookies to ensure that we give you the best experience on our website. If you continue to use this site we will assume that you are happy with it.