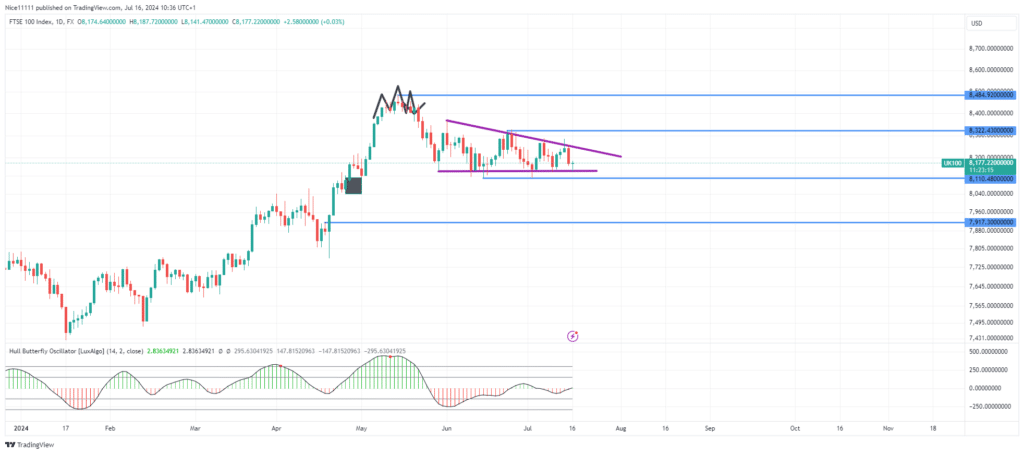
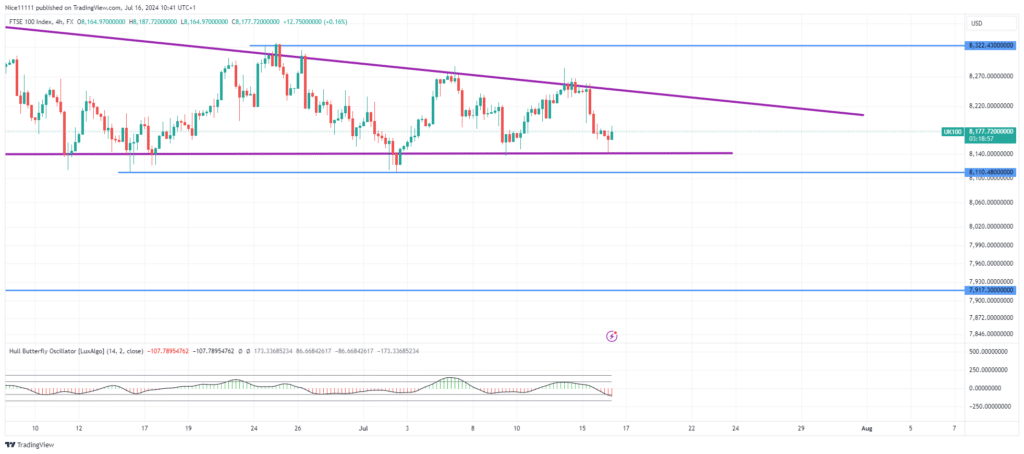
The FTSE 100 has remained in consolidation since the price pulled back to the demand level of 8,110.0. The stiff contention between market participants has led to the formation of a range on the daily chart. The price action continues to create lower highs and equal lows, resulting in the formation of a descending triangle on the daily chart.
The pullback to the bullish order block on May 1st led to a price explosion. The bullish momentum was evident with the presence of three white soldiers, leading to the formation of the current all-time high of 8,484.0. The Hull Butterfly Indicator revealed ascending bullish momentum until a head and shoulders pattern formed at 8,484.0.
The price retracement filled the region of inefficiency created by the three white soldiers in May. Buyers are struggling to protect the trend, as each attempt to soar is followed by a crash to the demand zone of 8,110.0. This is evident on trading platforms.
FTSE 100 Short-Term Trend: Ranging
As the range of price fluctuations narrows within the descending triangle, a breakout is looming. The anticipated impulsive displacement is expected to provide insight into the next major move of the market to establish safe forex signals.
Note: Learn2.trade is not a financial advisor. Do your research before investing your funds in any financial asset, product, or event. We are not responsible for your investment results.
Trade on MT4 with Leverage up to 1:500! Trade on MT4 with Leverage up to 1:500!
X
We use cookies to ensure that we give you the best experience on our website. If you continue to use this site we will assume that you are happy with it.