Don’t invest unless you’re prepared to lose all the money you invest. This is a high-risk investment and you are unlikely to be protected if something goes wrong. Take 2 minutes to learn more
Price action in the Flow market recently breached a key technical level. However, the market is struggling to push higher and is currently moving sideways. Nevertheless, the ongoing session holds some positive momentum. Let’s take a closer look.
FLOW Statistics
FLOW Current Price: $0.419
Market Capitalization: $660.96M
Circulating Supply: 1.56B
Total Supply: 1.56B
CoinMarketCap Rank: 89
Key Price Levels
Resistance: $0.4500, $0.5000, $0.5500
Support: $0.4000, $0.3500, $0.3000
 .4000" width="1436" height="606" data-lazy-src="https://learn2.trade/wp-content/uploads/2025/03/FLOWUSDT_2025-03-17_19-05-55.png"/>
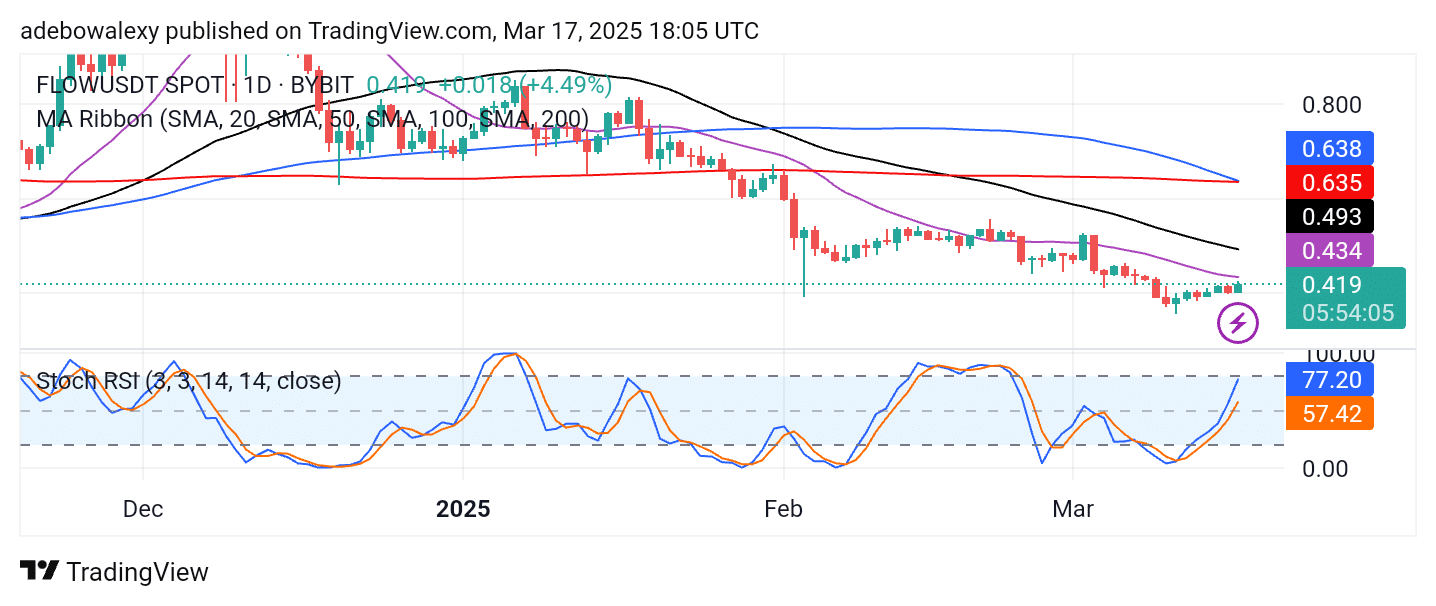
FLOW/USDT Stays Pressured but Holds Short-term Upside Potential
Recently, price action in the Flow market has taken on a slight upward trajectory. This movement has pushed the market past the psychological resistance level of $0.4000. The ongoing session remains bullish, as indicated by the corresponding price candle. However, trading activity is still occurring below all the Moving Average (MA) lines.
The Stochastic RSI lines are rising steeply and more rapidly than the actual price movement. Meanwhile, the 100-day and 200-day MA lines are converging for a crossover above price action. This reinforces the view that traders should anticipate only minimal gains from this market.
.4000" width="1436" height="606" data-lazy-src="https://learn2.trade/wp-content/uploads/2025/03/FLOWUSDT_2025-03-17_19-06-18.png"/>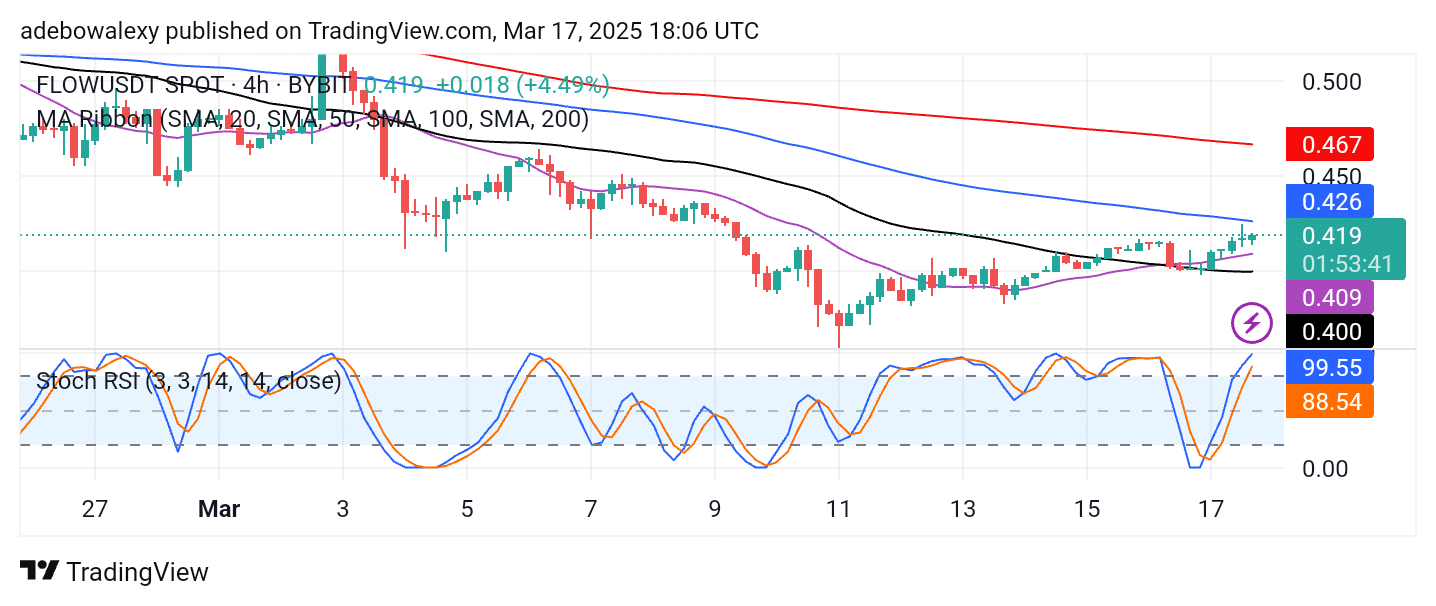
FLOW Buyers Are Eyeing Nearby Targets
On the 4-hour FLOW/USDT chart, price action has moved above the 20-day and 50-day MA lines. Additionally, recent price candles appear green, suggesting increased buying activity. Meanwhile, the Stochastic RSI lines have risen into the overbought region.
The behavior of this indicator remains consistent across both the daily and 4-hour charts, showing exaggerated movements. Therefore, traders should expect only a short-term upsidye move toward the $0.4500 price level.
Make money without lifting your fingers: Start trading smarter today
- Broker
- Min Deposit
- Score
- Visit Broker

- Award-winning Cryptocurrency trading platform
- $100 minimum deposit,
- FCA & Cysec regulated

- 20% welcome bonus of upto $10,000
- Minimum deposit $100
- Verify your account before the bonus is credited
- Fund Moneta Markets account with a minimum of $250
- Opt in using the form to claim your 50% deposit bonus
Learn to Trade
Never Miss A Trade Again

Signal Notification
Real-time signal notifications whenever a signal is opened, closes or Updated

Get Alerts
Immediate alerts to your email and mobile phone.

Entry Price Levels
Entry price level for every signal Just choose one of our Top Brokers in the list above to get all this free.