Don’t invest unless you’re prepared to lose all the money you invest. This is a high-risk investment and you are unlikely to be protected if something goes wrong. Take 2 minutes to learn more
Recently, price action in the Filecoin market picked up a bullish tone, which saw prices ramp up significantly in a single session. However, it looks like some holders saw the price increase as an opportunity to go short. As a result of their actions, price movement seems to be facing some challenges on its upward path.
Filecoin Statistics
FIL Value Now: $4.63
FIL Market Cap: $2B
Filecoin Circulating Supply: 433,557,235 FIL
FIL Total Supply: 1,962,043,086
Filecoin CoinMarketCap Ranking: 30
Major Price Levels:
Top: $4.63, $4.83, and $5.20
Base: $4.33, $4.03, and $3.67
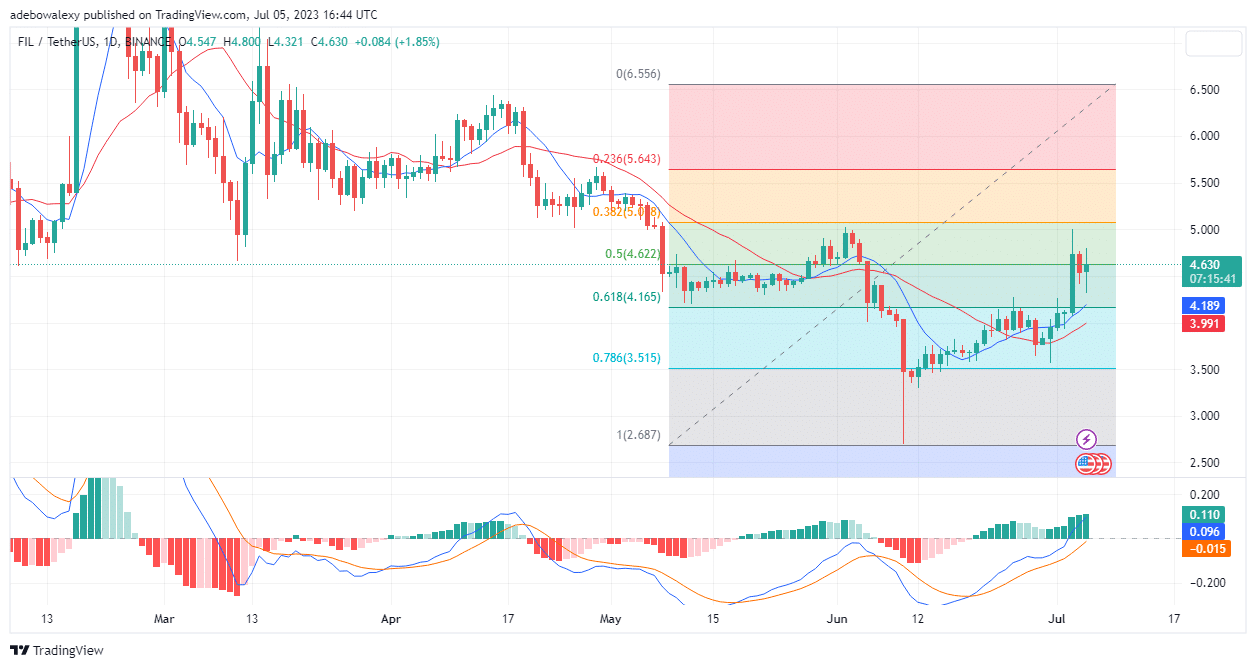
FILUSD Price Action Tests the Fibonacci Level 50
Although price action in the FILUSDT daily market has faced upside rejection in the just concluded session, it appears that buyers are seeking to extend the upside retracement.
A green price candle has appeared for the ongoing trading session, which has pushed prices to test the 50 level of the Fibonacci Retracement tool.
Meanwhile, the Moving Average Convergence Divergence (MACD) indicator lines are still rising upwards above the equilibrium level. Also, the bars of this indicator are solidly green, which indicates that price momentum is strong.
This effectively communicates that it is likely that price action will surpass the 50 level of the Fibonacci Retracement level. So, if buyers can conquer this resistance, more upside retracement may occur in this market.
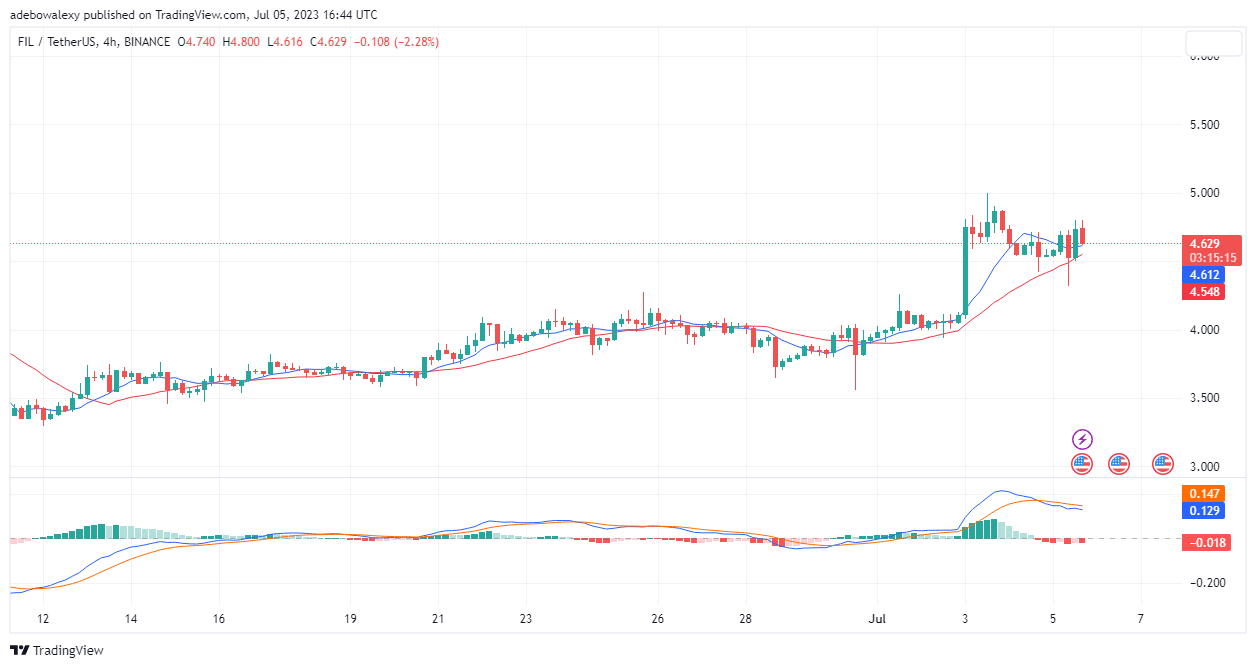
The Headwind in the Filecoin Market Threatens Price Upside Advancements
Extending this price analysis to the Filecoin 4-hour market, it is revealed that bears are currently taking a shot at price action in this market.
In the previous session, price activity poked above the 9-day Moving Average (MA) curve from its base on the 21-day MA curve. However, the ongoing trading session produced a downward correction in price.
This downward correction has brought the price towards the 9-day MA curve as support. The last price candle on this chart threatens upside ambition in this market. In addition, the MACD lines are now trending sideways above the equilibrium point.
With the appearance of a red bar below the equilibrium point, it is more likely that the support at the $4.60 price level fails. Consequently, this will allow the downward correction to extend to the $4.50 mark.
- Broker
- Min Deposit
- Score
- Visit Broker

- Award-winning Cryptocurrency trading platform
- $100 minimum deposit,
- FCA & Cysec regulated

- 20% welcome bonus of upto $10,000
- Minimum deposit $100
- Verify your account before the bonus is credited
- Fund Moneta Markets account with a minimum of $250
- Opt in using the form to claim your 50% deposit bonus
Learn to Trade
Never Miss A Trade Again

Signal Notification
Real-time signal notifications whenever a signal is opened, closes or Updated

Get Alerts
Immediate alerts to your email and mobile phone.

Entry Price Levels
Entry price level for every signal Just choose one of our Top Brokers in the list above to get all this free.