Don’t invest unless you’re prepared to lose all the money you invest. This is a high-risk investment and you are unlikely to be protected if something goes wrong. Take 2 minutes to learn more
The Fantom token’s price has seen minimal changes in today’s trading activity so far. The token has experienced a 2.08% price increase today, making it the second most profitable coin at the time of writing. Nevertheless, its price action shows that the market is currently facing resistance.
.5100 Mark" width="580" height="308" data-lazy-src="https://learn2.trade/wp-content/uploads/2024/08/FTMUSDT_2024-08-26_05-50-24_055328-1024x543.png"/>
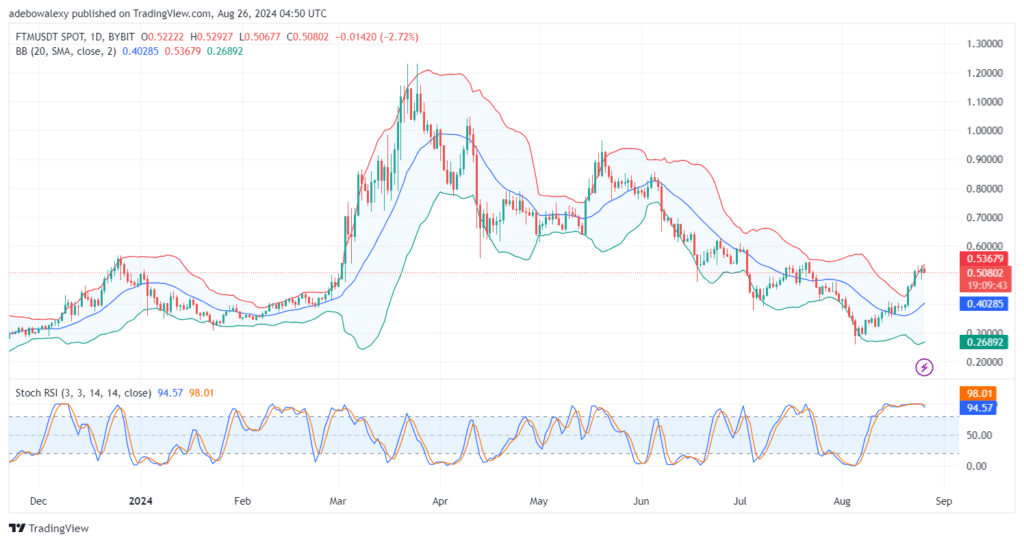
Fantom Faces Difficulty Breaking Through the $0.5100 Mark
Price action in the FTM daily market broke through the $0.5000 mark three sessions ago. However, the market hasn’t gathered the needed momentum to rise significantly further, leading to price action consolidating above this price region. As a result, price candles in the market can be seen lingering around the uppermost band of the Bollinger Bands (BB) indicator.
The last price candle on the chart is red, indicating that downward forces are more dominant in the session. Nevertheless, price activity remains above the $0.5000 mark and at a significant distance above the middle limit of the BB indicator. The Stochastic Relative Strength Index (Stochastic RSI) lines are still in the overbought region, though the terminal part appears to be trending downward.
.5100 Mark" width="580" height="308" data-lazy-src="https://learn2.trade/wp-content/uploads/2024/08/FTMUSDT_2024-08-26_05-50-49_055326-1024x543.png"/>
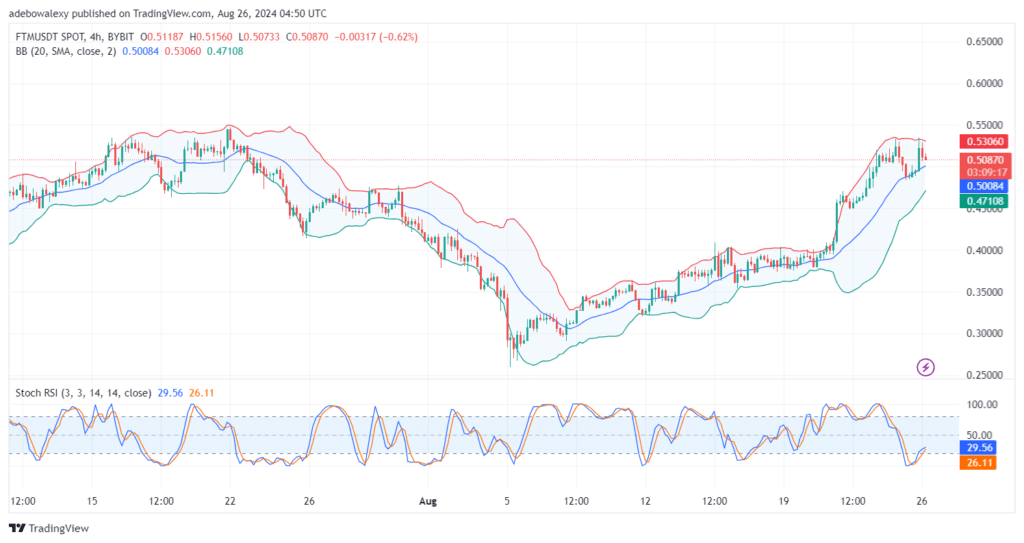
FTM Market Is Holding an Upside Focus
On the 4-hour Fantom market chart, technical indicators still hint at the possibility of price action resuming an upward path. Here, the BB indicator shows a general upward trajectory. Additionally, the upper and lower bands of the indicator can be seen starting to contract. Meanwhile, price action remains above the middle limit of the BB indicator.
The ongoing session appears to be facing resistance from upward forces, as indicated by the appearance of the corresponding price candle. Furthermore, the Stochastic RSI lines are following an upward path from deep within the oversold region. Therefore, it seems that price action may resume its upward trajectory, with traders potentially targeting regions above the $0.5100 price level via the use of bullish crypto signals.
Trade on MT4 with Leverage up to 1:500! Trade on MT4 with Leverage up to 1:500!
X
We use cookies to ensure that we give you the best experience on our website. If you continue to use this site we will assume that you are happy with it.
 .5100 Mark" width="580" height="308" data-lazy-src="https://learn2.trade/wp-content/uploads/2024/08/FTMUSDT_2024-08-26_05-50-24_055328-1024x543.png"/>