Don’t invest unless you’re prepared to lose all the money you invest. This is a high-risk investment and you are unlikely to be protected if something goes wrong. Take 2 minutes to learn more
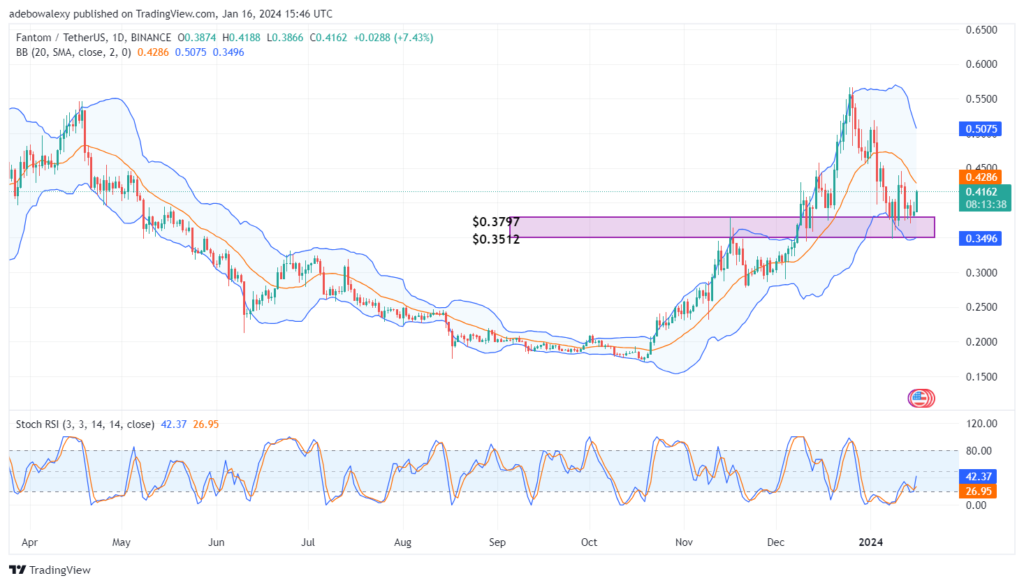
Fantom’s price had earlier surged through the resistance level at the $0.5500 mark. However, bulls seem to have exhausted themselves at that point, leading to a downward retracement. But as soon as the price action tested the support at the $0.3797 mark, it was rejected back upwards. Trading has continued above this level, and more moves seem to be on the way.
FTM Statistics:
Current Fantom Value: $0.4186
Fantom Market Cap: $1,171,573,772
FTM Circulating Supply: 2,803,634,836 FTM
Fantom Total Supply: 3,175,000,000 FTM
FTM CoinMarketCap Ranking: 61
Key Price Levels:
Resistance: $0.4186, $0.4250, and $0.4500
Support: $0.4100, $0.4000, and $0.3900

The Fantom Market Looks Ready to See Higher Price Levels
Price activity in the FTM daily market had started oscillating within a fairly wide range of $0.4280 and $0.3797 about nine sessions ago. This, as mentioned earlier, began when the resulting downward correction from the $0.5500 mark hit the support at the $0.3797 mark. Nevertheless, today’s session has yielded some moderate profit, as the token’s price has increased by roughly 5.10%.
The size of the last price candle on this chart shows that traders are going long in this market. Even the Stochastic Relative Strength Indicator (RSI) has delivered a bullish crossover above the 20 mark of the indicator. The crossover seems young and is more likely to extend upward, thereby supplying bullish confidence to traders. Consequently, this will likely push price action through the middle limit of the Bollinger Bands indicator, strengthening bullish anticipation in this market.

FTM Seems Gearing Up for More Significant Price Increases
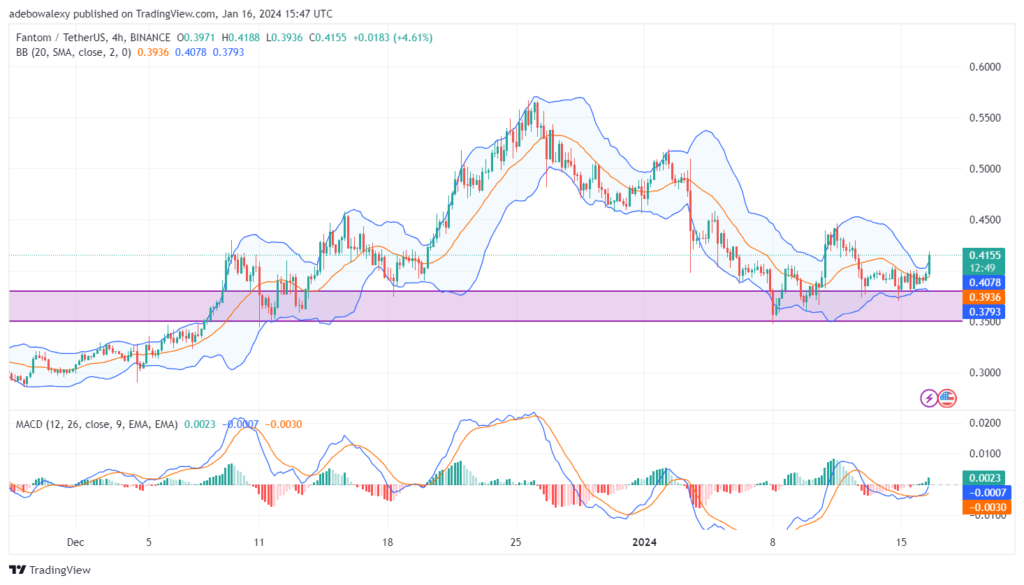
Bullish optimism continues to strengthen on the Fantom 4-hour market. Here, one could see that price action had steadily risen through the middle limit of the Bollinger Bands. Furthermore, the following session has landed with a more significant price increase than the ones seen in most recent times in this market.
Consequently, the ongoing session has placed the token to now trade above the uppermost bands of the applied Bollinger Bands indicator. Likewise, the Moving Average Convergence Divergence (MACD) indicator curves have taken a steep upward path. In fact, the last bar above the indicator’s equilibrium level has grown taller than in recent times. This signals a growth in bullish momentum and suggests that price action is eyeing the $0.4500 mark.
Trade crypto coins on AvaTrade
- Broker
- Min Deposit
- Score
- Visit Broker
- Award-winning Cryptocurrency trading platform
- $100 minimum deposit,
- FCA & Cysec regulated
- 20% welcome bonus of upto $10,000
- Minimum deposit $100
- Verify your account before the bonus is credited
- Fund Moneta Markets account with a minimum of $250
- Opt in using the form to claim your 50% deposit bonus
Learn to Trade
Never Miss A Trade Again

Signal Notification
Real-time signal notifications whenever a signal is opened, closes or Updated

Get Alerts
Immediate alerts to your email and mobile phone.

Entry Price Levels
Entry price level for every signal Just choose one of our Top Brokers in the list above to get all this free.


