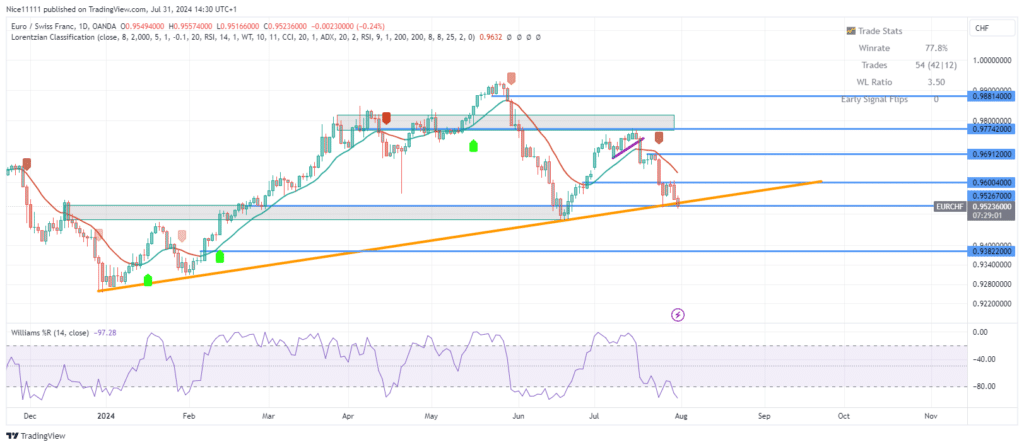
The EURCHF market encountered resistance at the 0.9770 supply zone, prompting a price decline for a retest on the supporting trendline visible on the daily chart. This recent movement has been closely monitored by traders, as it suggests potential further bearish activity.
EURCHF Key Levels
Demand Levels: 0.9530, 0.9380, 0.9320
Supply Levels: 0.9690, 0.9770, 0.9880
EURCHF Long-Term Trend: Bearish
In July, the Williams Percent Range indicated that the market was overbought when the price reached a significant level of 0.9770. This overbought condition led to the formation of a double top pattern, a classic bearish reversal signal, which suggested a shift in market structure.
Following the price displacement from this zone, the Machine Learning Lorentizan Classification Indicator issued a short signal, reinforcing the bearish sentiment. The price subsequently plummeted to the bullish trendline, marking a significant downturn in the market.
EURCHF Short-Term Trend: Bearish
Currently, the Relative Strength Index (RSI) indicates oversold conditions on both the higher (daily) and lower (4-hour) time frames. The market structure remains bearish, with no clear signs of a bullish reversal. The bearish trend is likely to continue unless there is a significant change in market conditions.
Traders must confirm indicator signals with the overall market structure before considering a long position. Monitoring these key levels and indicators will be essential in anticipating potential market movements and making informed trading decisions.
Trade on MT4 with Leverage up to 1:500! Trade on MT4 with Leverage up to 1:500!
X
We use cookies to ensure that we give you the best experience on our website. If you continue to use this site we will assume that you are happy with it.

 EURCHF Short-Term Trend: Bearish
 EURCHF Short-Term Trend: Bearish


