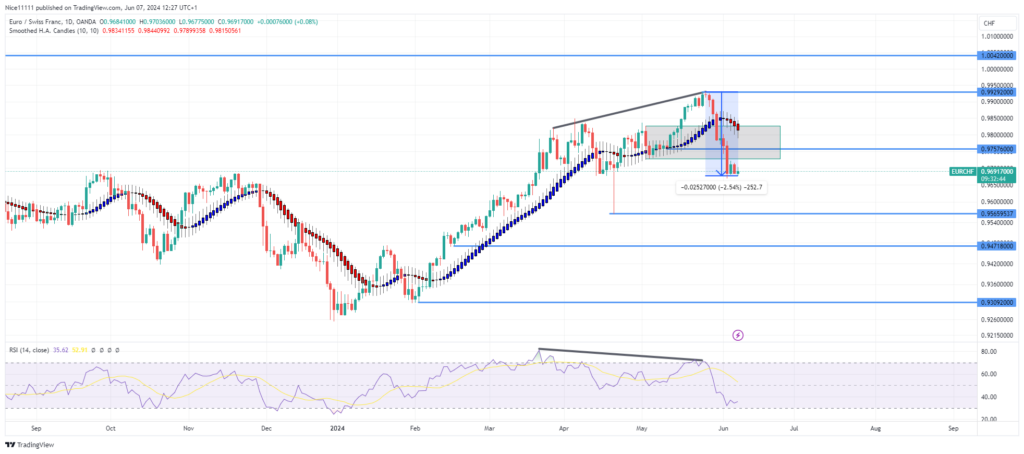
EURCHF has experienced a notable decline of 2.54% since reaching a swing high of 0.9930. The bullish order block at 0.9800, which previously acted as a support level, has failed to hold, indicating the onset of a bearish trend.
Despite the recent downturn, EURCHF’s long-term trend remains bullish. However, the RSI (Relative Strength Index) on the daily chart has highlighted market weakness. On May 29, while the market formed a higher swing high at 0.9930, the RSI showed a lower high, indicating a bearish divergence. This divergence, occurring in the overbought region, signaled bullish exhaustion.
Following the formation of the swing high at 0.9930, the price dipped into the bullish order block at 0.9800. The subsequent price drop breached this support level, defying the bullish order block. Currently, the Smoothed Heikin Ashi Candles have turned red, hovering above the daily candles, further suggesting bearish momentum.
EURCHF Short-Term Trend: Bearish
The recent price action supports a bearish outlook in the short term. This price crash can be utilized to generate forex signals, with the best signals likely considering a double break of structure to the downside to further establish a downward trend.
Note: Learn2.trade is not a financial advisor. Do your research before investing your funds in any financial asset or presented product or event. We are not responsible for your investing results.
Trade on MT4 with Leverage up to 1:500! Trade on MT4 with Leverage up to 1:500!
X
We use cookies to ensure that we give you the best experience on our website. If you continue to use this site we will assume that you are happy with it.

 EURCHF Short-Term Trend: Bearish
 EURCHF Short-Term Trend: Bearish


