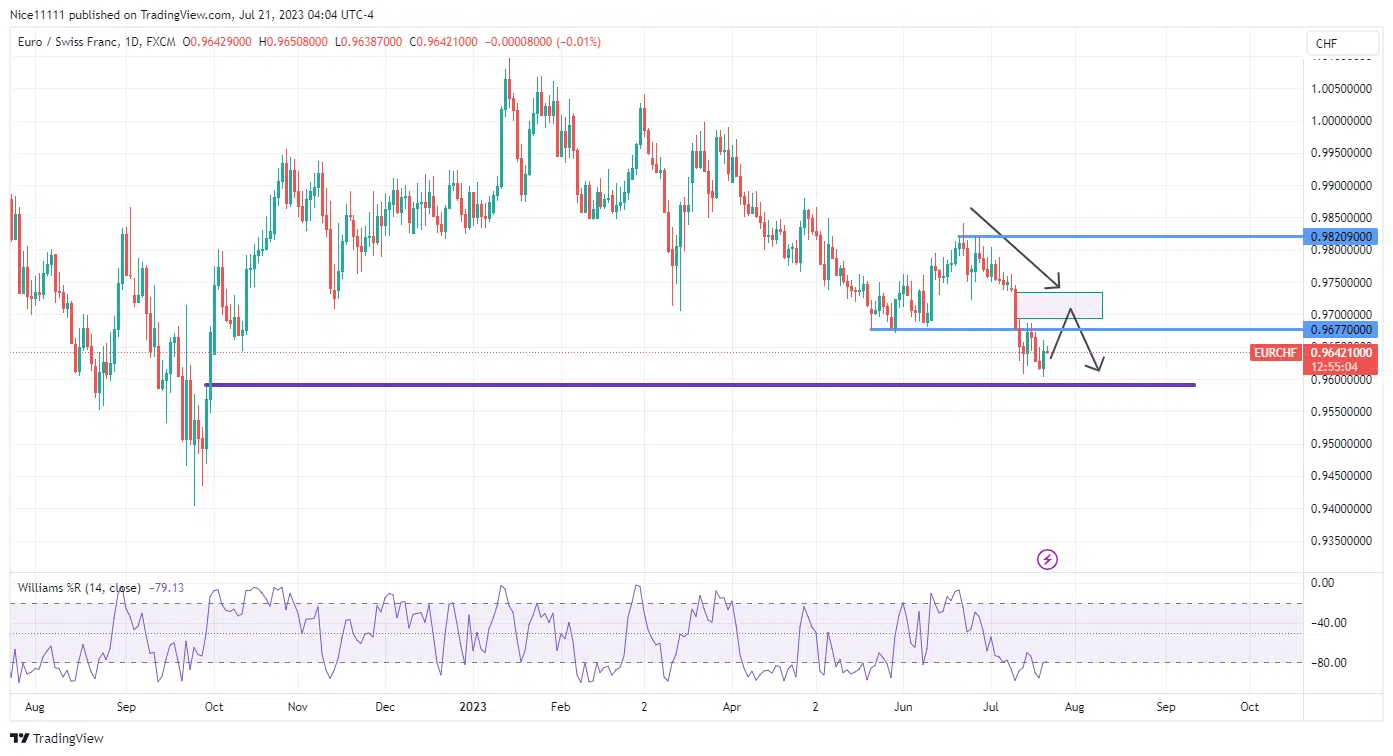
The EURCHF price dipped below the crucial support level of 0.9680. This dip was initiated during an accumulation phase when the market explored the supply zone around 0.9820. The Williams Percent Range analysis revealed an overbought condition at the supply level, sparking interest and concern among traders.
The formation of a Double-top pattern below the supply zone further intensified the market’s momentum, leading to heavy shorting activity. This shift from the accumulation to the distribution phase triggered a swift price movement towards the 0.9600 mark, catching many traders off guard.
As the market enters a consolidation phase after the bearish expansion, a fascinating aspect to watch is the inefficiently traded region resting above the current consolidation. The remarkable speed of the previous price movement has left a gap in this area, which now acts as a magnetic force on the price, attracting traders’ attention.
The liquidity region above the current range has become an attractive anchor for shorts, creating a potential catalyst for another bearish expansion. Traders and investors alike are closely monitoring this area, waiting for an optimal entry point to join the market momentum.
Notably, the Williams Percent Range indicator currently indicates an oversold condition, heightening expectations for a corrective move back to the inefficiently traded region. This potential correction could pave the way for traders to capitalize on the market’s inefficiencies and make well-timed trades.
EURCHF Short-Term Trend: Bullish
The discrepancy between the Williams % range readings on the four-hour chart and the daily chart is striking, with the former indicating an overbought condition. At the same time, the latter presents a different perspective.
Moreover, the four-hour chart has recently witnessed a bullish break of structure, further adding complexity to the current market situation. As a result, there is an anticipation of a pullback to the inefficiently traded region on the lower timeframe, with the potential to facilitate an ascent towards the inefficient traded region on the daily chart.
We use cookies to ensure that we give you the best experience on our website. If you continue to use this site we will assume that you are happy with it.


 EURCHF Short-Term Trend: Bullish


