In the previous trading period, EUR/JPY lost all its gathered profits since late September this year. Nevertheless, in this ongoing session buyers seem to have brought about a recoup of a very small fraction of the incurred losses. Will more recovery be recorded? Let’s further examine the market to that effect.
Important price Levels:
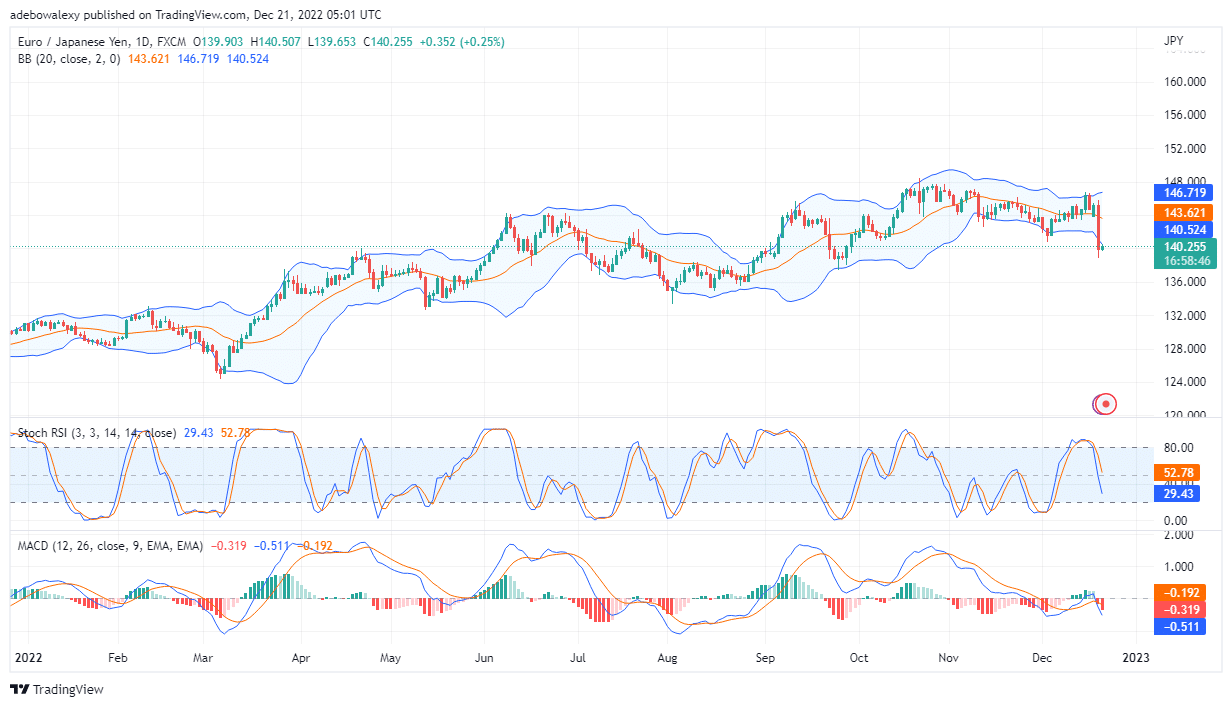
Resistance Levels: 140.26, 142.50, 145.00
Support Levels: 138.00, 136.00, 135.00
EUR/JPY May Incur Further Losses
EUR/JPY daily market chart reveals that the pair may still experience further losses. This inference is drawn from signs coming from technical indicators. The price candle for the previous trading sessions has pushed the lowest limit of the Bollinger band Indicator. Subsequently, a tiny rebound has been occurred in the opposite direction, however, it is too early to tell if it may grow significantly. Also, the lines of both the MACD and the Stochastic RSI indicator are concurrently diving. Consequently, the two indicators are aligning to predict further price decreases in this market.
Is EUR/JPY Recovery Attempt Meeting Setbacks Already?
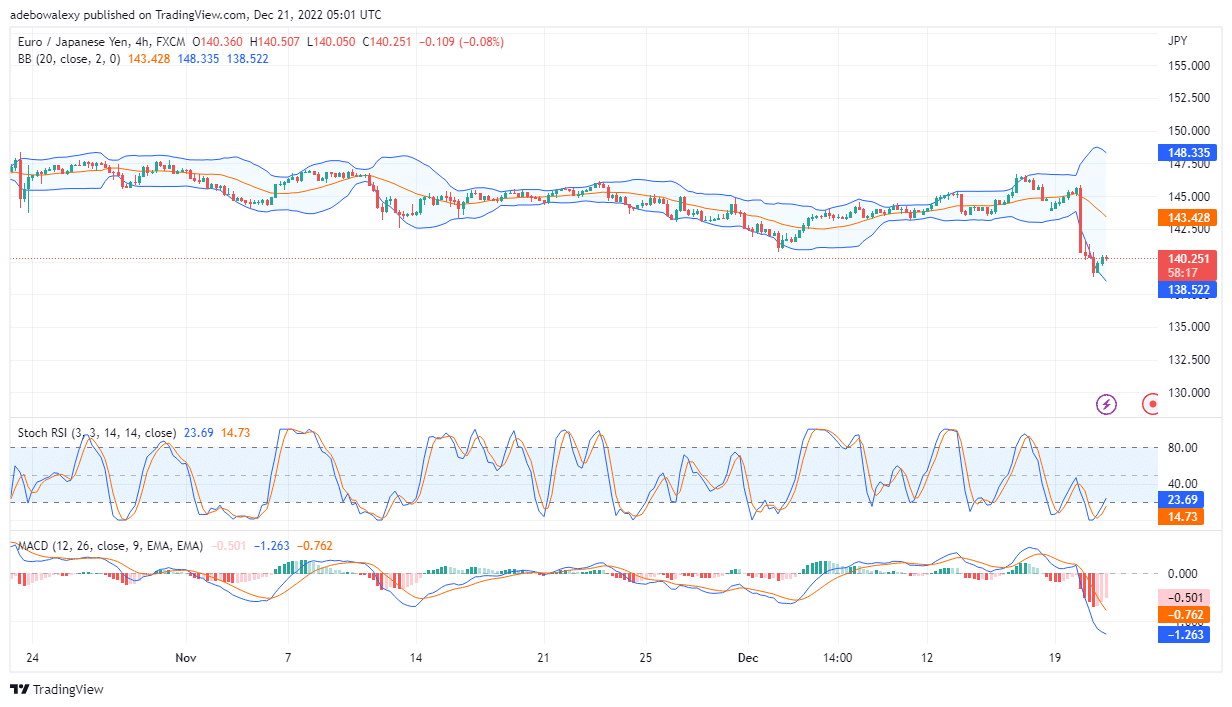
Following the heavy headwind experienced in the EUR/JPY market, activities on the 4-hour market seem to be foretelling that price action may have started experiencing some setbacks. The last price candle on this chart is a bearish price candle with a short both a short body and wick. Consequently, this is showing that some resistance has been met in this market at this point. However, the Stochastic RSI and the MACD indicator are showing signs of a possible continued upside move. The RSI lines are now moving upwards from the oversold. Likewise, the histogram bars on the MACD are now portraying a reduction in downside momentum as well. Perhaps something interesting is building up on the 4-hour market, trader can stay on the sidelines to see how the ongoing session will end. This will help them to see if the upside movement will continue toward the 142.00 level or not.
Do you want to take your trading to the next level? Join the best platform for that here.
- Broker
- Min Deposit
- Score
- Visit Broker

- Award-winning Cryptocurrency trading platform
- $100 minimum deposit,
- FCA & Cysec regulated

- 20% welcome bonus of upto $10,000
- Minimum deposit $100
- Verify your account before the bonus is credited
- Fund Moneta Markets account with a minimum of $250
- Opt in using the form to claim your 50% deposit bonus
Learn to Trade
Never Miss A Trade Again

Signal Notification
Real-time signal notifications whenever a signal is opened, closes or Updated

Get Alerts
Immediate alerts to your email and mobile phone.

Entry Price Levels
Entry price level for every signal Just choose one of our Top Brokers in the list above to get all this free.