EURCHF remains confined within a long-term trading range, indicating a prolonged period of equilibrium between buyers and sellers. The most significant recent development was a vigorous rally erupting from the critical 0.9260 support level, which forms the lower boundary of this extended range. This strong bullish leg demonstrated a clear influx of buying interest, successfully propelling the pair higher. However, this upward progress has now encountered its first formidable barrier: the 0.9445 resistance zone, a level that has historically triggered reversals.
EURCHF Key Levels
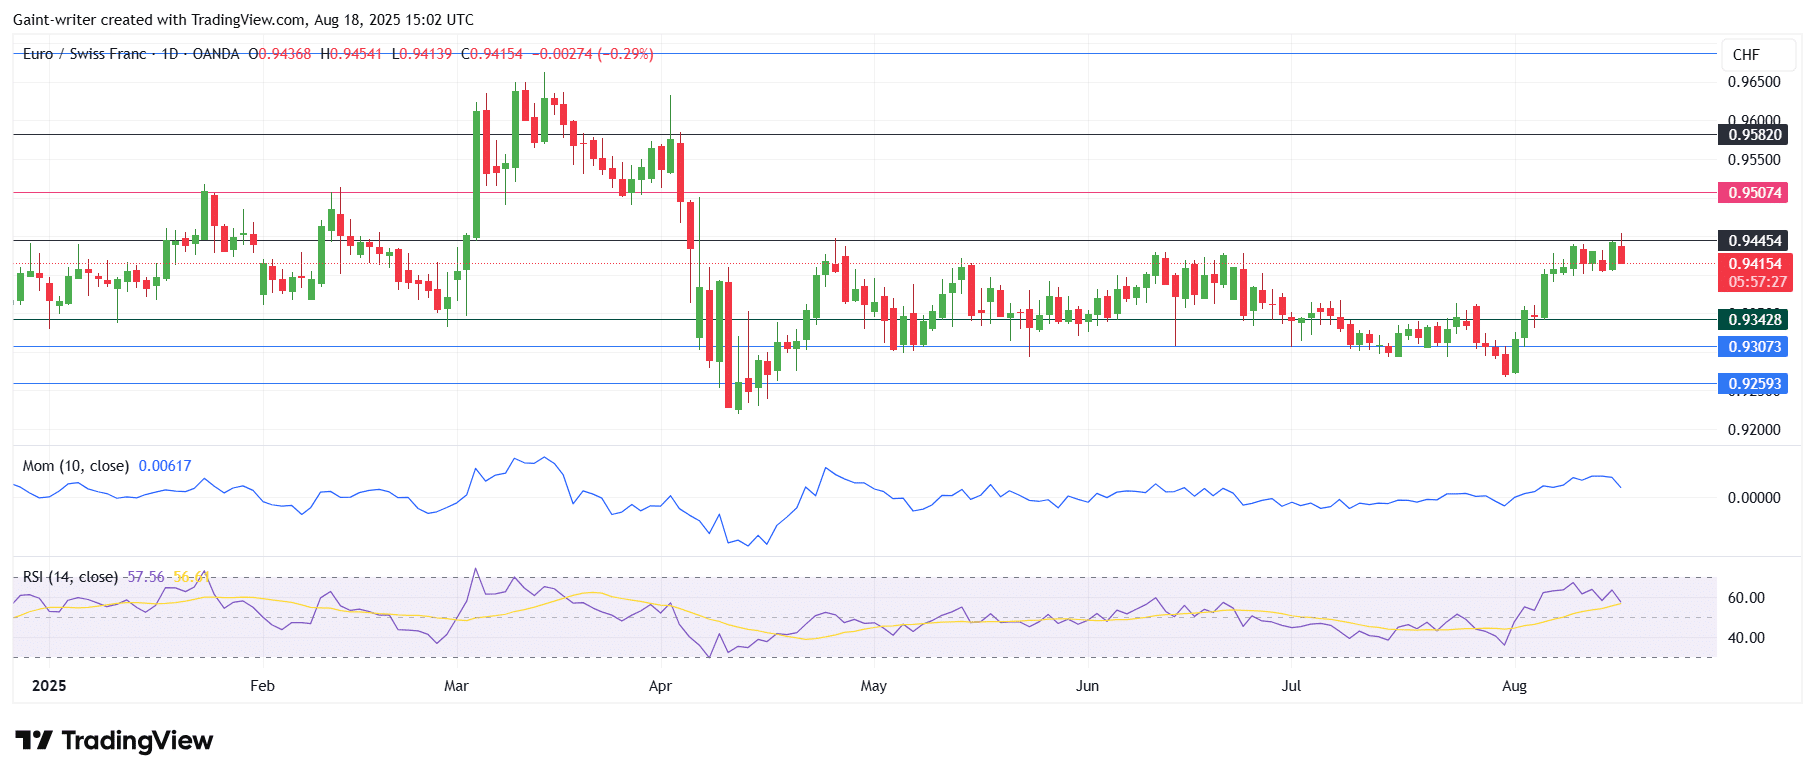
Support Levels: 0.9342, 0.9307, 0.9250 Resistance Levels: 0.9440, 0.9500, 0.9580
EURCHF Long-Term Trend: Ranging
Upon reaching the resistance level of 0.9445, the upward momentum has demonstrably faded. The most recent daily candlestick evolved into a “spinning top,” a pattern characterized by a small real body with pronounced wicks on both ends. The emergence of this specific candle, especially after a strong advance and directly at a known resistance level, is a textbook signal of market indecision and a loss of bullish conviction; it suggests the initiating bulls are now taking a deliberate pause.
The Momentum indicator, although still positive at 0.0061, has unmistakably begun to roll over. This rounding off indicates a tangible deceleration in the pace of the recent advance, a sign that buying pressure is waning. Similarly, the Relative Strength Index (RSI) reading of 57.26, while still in bullish territory, has started to flatten its trajectory. This loss of upward slope confirms that the buying thrust is meeting substantial opposition, effectively neutralising the immediate bullish momentum and creating a stalemate.
EURCHF Short-Term Trend: Bullish
A closer examination of the 4-hour chart provides granular detail on the current impasse. After its robust ascent, the pair has entered a phase of tight, horizontal consolidation, just beneath the 0.9440 resistance level. Analysts frequently interpret this coiling pattern as a “bullish consolidation” or a “basing” pattern. The Momentum indicator on this shorter timeframe has plummeted to a neutral 0.00042, showing a lack of energy. This signifies that buyers are patiently absorbing available selling pressure without conceding significant ground, potentially accumulating energy for another rally.
Trade on MT4 with Leverage up to 1:500! Trade on MT4 with Leverage up to 1:500!
X
We use cookies to ensure that we give you the best experience on our website. If you continue to use this site we will assume that you are happy with it.

 EURCHF Short-Term Trend: Bullish
  EURCHF Short-Term Trend: Bullish


