

Ethereum (ETH) Current Statistics
The current price: $3,680.92
Market Capitalization: $443,411,359,759.40
Trading Volume: $31,405,134,883.98
Major supply zones: $3,500, $4,000, $4,500
Major demand zones: $2,500, $2,000, $1,500
Ethereum (ETH) Price Analysis December 1, 2024
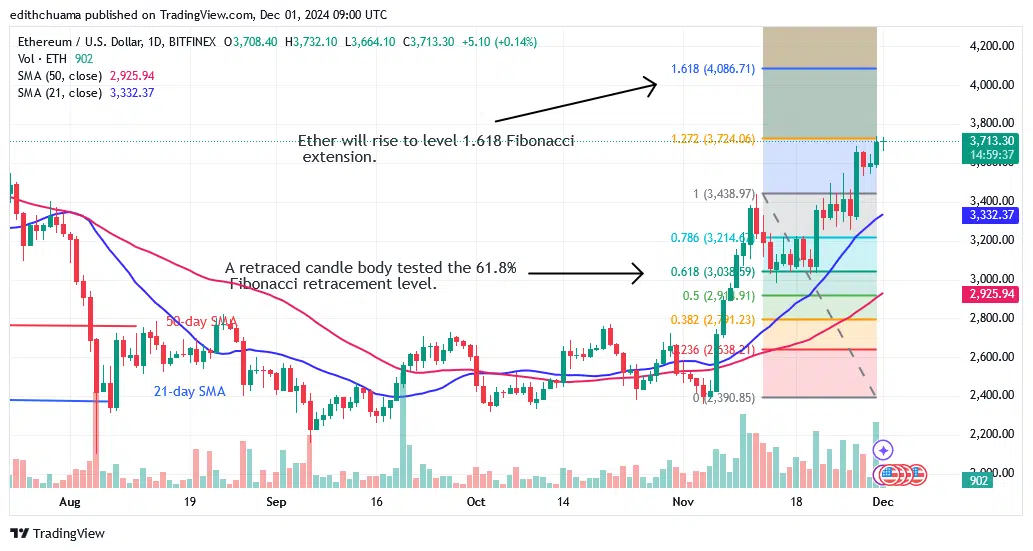
Ethereum’s (ETH) price begins a second round of upward momentum but fails to cross the $3,700 mark. To hit the psychological price level of $4,000, the bulls must break through resistance at $3,800. The Fibonacci price indicator showed a retraced candle body testing the 61.8% Fibonacci retracement line. The retracement indicates that the biggest altcoin has the potential to rise to the upside.
ETH Technical Indicators Reading
The price bars represent moving average lines, which limit the cryptocurrency’s upward movement. On the 4-hour chart, the cryptocurrency price is exhibiting a pattern of higher highs and lows. The current rally has been gradual due to the development of Doji candlesticks. On the positive, a price rebound will help the cryptocurrency rise.
Conclusion
Ether is on the rise but fails to cross the $3,700 mark. However, following the breakout, the altcoin has fallen below the $3,700 support. On the 4-hour chart, bears pierced the 21-day SMA, but bulls bought dips. Despite recent declines, the crypto signal remains bullish. Doji candlesticks dominate the price movement.

Make money without lifting your fingers: Start using a world-class auto trading solution.
Note: Learn2.Trade is not a financial advisor. Do your research before investing your funds in any financial asset or presented product or event. We are not responsible for your results.


