Ether has slumped to the low of $3,165
The market approaches the oversold region
Ethereum ETH) Current Statistics
The current price: $3,205.48
Market Capitalization: $384,439,918,573
Trading Volume: $10,872,393,806
Major supply zones: $4,000, $4,500, $5,000
Major demand zones: $3,500, $3,000, $2,500
Ethereum (ETH) Price Analysis April 10, 2022
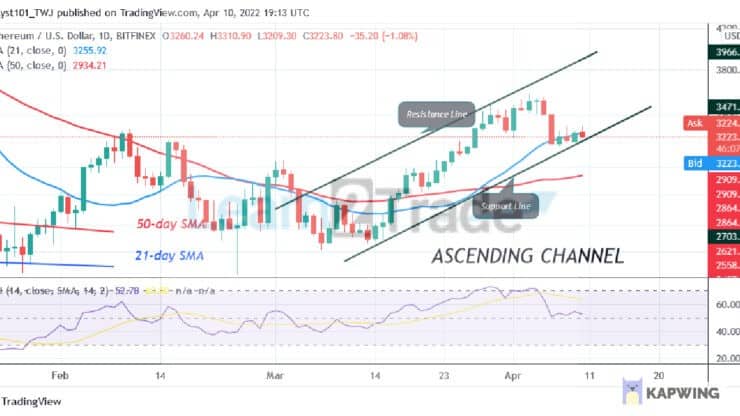
Ethereum’s (ETH) price has fallen to the low of $3,165 as it resumes a sideways trend. The largest altcoin has earlier rallied to the high of $3,578 but failed to sustain the bullish momentum. Ether fell because the market reached an overbought region. The altcoin fell below the 21-day line SMA but above the 50-day line moving average. The cryptocurrency is fluctuating between the moving averages. It implies that the altcoin will be compelled to a range-bound move for a few more days. On the upside, if price breaks above the 21-day SMA, the market will revisit the resistance at $3,400 and $3,500. On the downside, Ether is trading at the $3,165 support. A break below the current support will compel the altcoin to decline to the low of $2,916 low.
ETH Technical Indicators Reading
Ether’s price bars are now between the moving averages indicating a possible range bound move of the cryptocurrency. The altcoin is at level 51 of the Relative Strength Index for period 14. It indicates that there is a balance between supply and demand. . It is below the 40% range of the daily stochastic. The market is in a bearish momentum and approaching the oversold region of the market. The 50-day line and 21-day line are sloping upward indicating the uptrend.
Conclusion
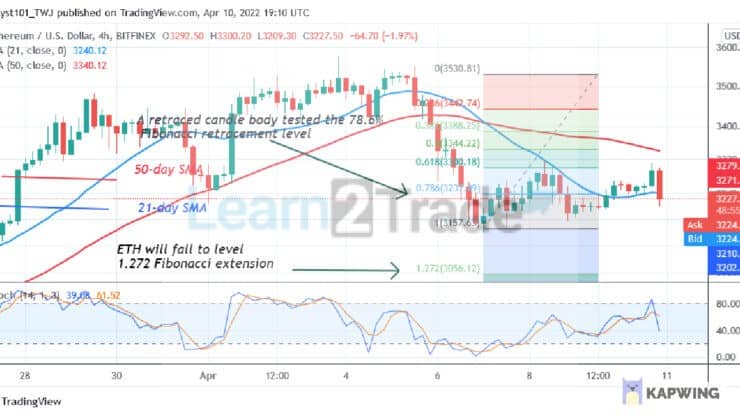
Ethereum is in a downward move as it resumes a sideways trend. Meanwhile, on April 6 downtrend; a retraced candle body tested the 78.6% Fibonacci retracement level. The retracement indicates that ETH will fall but reverse at level 1.272 Fibonacci extension or $3,056.12. From the price action, Ether is falling and approaching the low of $3,195.60.
You can purchase crypto coins here. Buy LBlock:
Note: Learn2.Trade is not a financial advisor. Do your research before investing your funds in any financial asset or presented product or event. We are not responsible for your investing
- Broker
- Min Deposit
- Score
- Visit Broker

- Award-winning Cryptocurrency trading platform
- $100 minimum deposit,
- FCA & Cysec regulated

- 20% welcome bonus of upto $10,000
- Minimum deposit $100
- Verify your account before the bonus is credited
- Fund Moneta Markets account with a minimum of $250
- Opt in using the form to claim your 50% deposit bonus
Learn to Trade
Never Miss A Trade Again

Signal Notification
Real-time signal notifications whenever a signal is opened, closes or Updated

Get Alerts
Immediate alerts to your email and mobile phone.

Entry Price Levels
Entry price level for every signal Just choose one of our Top Brokers in the list above to get all this free.