Ethereum (ETH) Current Statistics
The current price: $2,501.70
Market Capitalization: $302,098,652,937.79
Trading Volume: $12,010,233,937.57
Major supply zones: $3,500, $4,000, $4,500
Major demand zones: $2,500, $2,000, $1,500
Ethereum (ETH) Price Analysis June 1, 2025
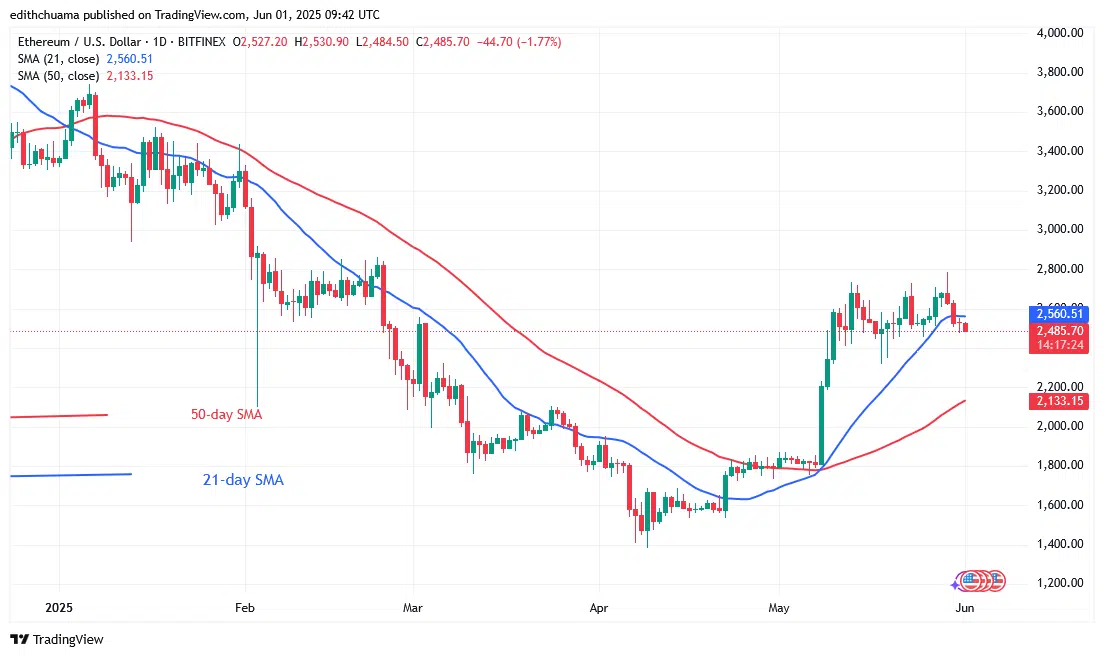
Ethereum’s (ETH) price loses the critical $2,500 support after its rejection at $2,784. The negative trend’s extension violated the 21-day SMA support. Since buyers were unable to keep the price above the $2,800 threshold, Ether’s bullish rise has been deemed invalid. As the bears break below the 21-day SMA support, however, the bearish momentum will continue above the psychological price level of $2,000 or the 50-day SMA support.
ETH Technical Indicators Reading
The crypto price has fallen below the 21-day SMA support. It is below the 21-day SMA barrier but above the 50-day SMA support. Ether price bars are located between the moving average lines. The moving average lines are sliding upward in spite of the recent downturn. On the lower time frame, the moving average lines are horizontal, suggesting a sideways shift since May 13.
Conclusion
Ethereum maintains its downward slide after losing the critical $2,500 support. Presently, Ether will be trading in a range between the moving average lines. The largest altcoin will be trading below the $2,600 high and above the $2,100 support. The altcoin will drop and pause above the $2,300 support on the downside. If the $2,300 support is broken, the bearish trend will continue to spread to the bottom of $2,000.

Make money without lifting your fingers: Start using a world-class auto trading solution.
Note: Learn2.Trade is not a financial advisor. Do your research before investing your funds in any financial asset presented product, or event. We are not responsible for your results.