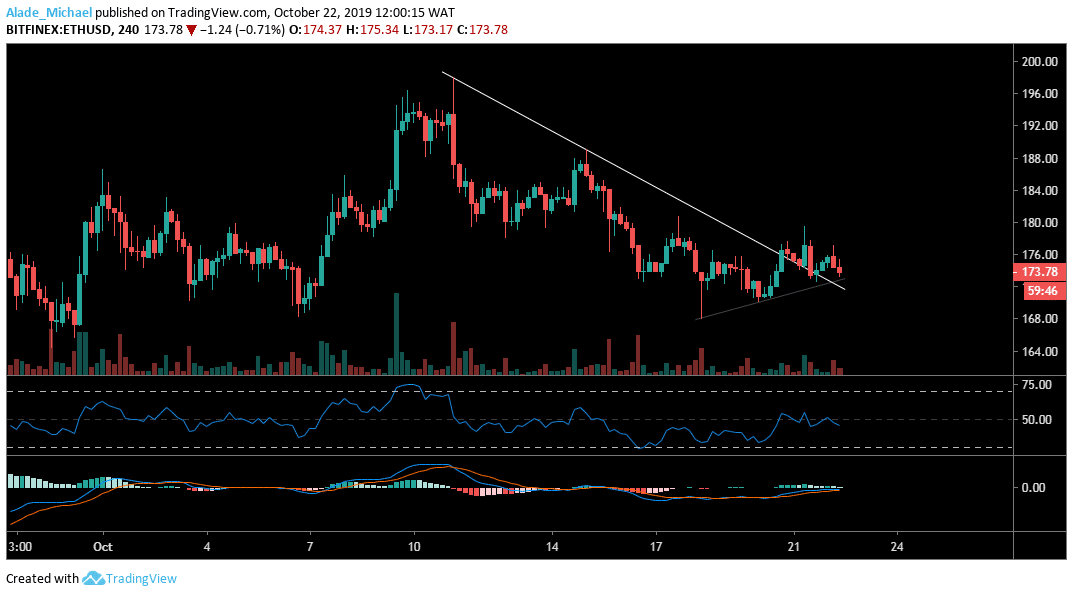
Over the past five days, Ethereum has been trading below $180 following the October 11 huge sell-off at $196. ETH is currently roaming around the $173 after seeing a little price increase over the weekend, although the trend is still looking bearish on a medium-term. The ETH price appeared stable at the moment. We can expect a sudden price change once trading volatility increases.
Ethereum (ETH) Price Analysis: 4H Chart – Bearish
Key resistance levels: $177, $187, $193, $198
Key support levels: $170, $167, $160, $151
On the 4-hours chart, Ethereum is revealed in a downward range but has managed to stay above the $170 support despite the last ten days decline. Should supply outweigh demand; we may see an instant sell to $167 and $160 after surpassing $170 support. The $151 is the last support area for the bulls to defend. We can see that the MACD indicator is negative, although lying near the zero level.

Producing a bullish cross might cause the market to raise at $177, $187 $193 and $198 on a short-term buy. However, the trading crypto signals that Ethereum is slowly rising back but currently waiting at the 50 level. We can expect more price increase if the RSI 30 can bolster as strong support.
Ethereum (ETH) Price Analysis: Hourly Chart – Bullish
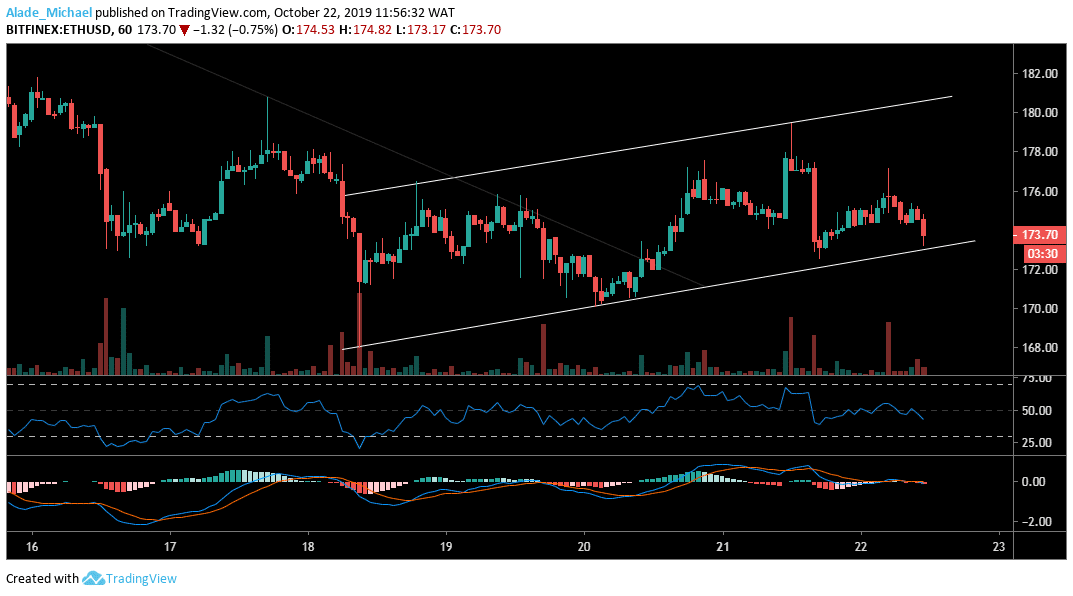
Zooming into the hourly chart, we can see that ETH has seen significant volatility to the upside over the last 4 days, allowing the market to follow a bullish sentiment. Meanwhile, the market is near the channel’s support as sellers target the $170 support but the break signal is yet to validate. If the price channel’s lower boundary can contain selling pressure, the price is likely to bounce higher to $176 and $178 and potentially $180 resistance.

But looking at the current RSI, the market is heading back to the negative to show that the sellers are returning in the market. As said earlier, the $170 remains a key support area for the bears. Further support lies at $168 as new support may hold at $166. The MACD is now lying at the zero level, showing that the market is indecisive at the moment.
ETHEREUM BUY SIGNAL
Buy Entry: $173
TP: $183
SL: 170
- Broker
- Min Deposit
- Score
- Visit Broker
- Award-winning Cryptocurrency trading platform
- $100 minimum deposit,
- FCA & Cysec regulated
- 20% welcome bonus of upto $10,000
- Minimum deposit $100
- Verify your account before the bonus is credited
- Fund Moneta Markets account with a minimum of $250
- Opt in using the form to claim your 50% deposit bonus
Learn to Trade
Never Miss A Trade Again

Signal Notification
Real-time signal notifications whenever a signal is opened, closes or Updated

Get Alerts
Immediate alerts to your email and mobile phone.

Entry Price Levels
Entry price level for every signal Just choose one of our Top Brokers in the list above to get all this free.


