Key Highlights
Ether resumes selling pressure, may fall below $300
Ethereum loses $350 critical support
Ethereum (ETH) Current Statistics
The current price: $337.62
Market Capitalization: $38,117,794,920
Trading Volume: $13,669,638,657
Major supply zones: $280, $320, $360
Major demand zones: $160, $140, $100
Ethereum (ETH) Price Analysis October 7, 2020
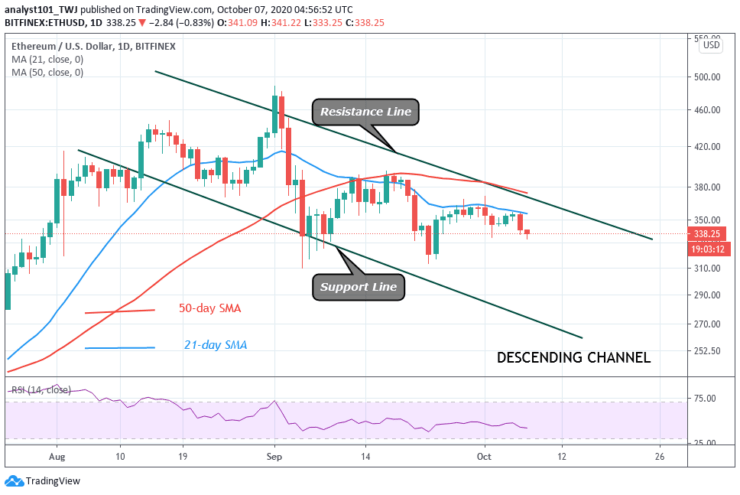
Ether has resumed a downward move after the bulls fail to sustain price above the $350 support. Buyers fail to hold on the price after three days of price tussle with sellers. The bears broke the $350 support and after retesting it, the downtrend resumes.
The biggest altcoin is trading at $336 at the time of writing. If the crypto retraces and breaks below the current support at $313, the selling pressure will persist. Conversely, if the support above $300 holds, the market will continue the upward move. Otherwise, the downtrend will continue.
ETH Technical Indicators Reading
Yesterday, ETH price faces rejection at the 21-day SMA as price resumes a downward move. The coin is at level 41 of the Relative Strength Index period 14. It indicates that the coin is in a downtrend and below the centerline 50.
Conclusion
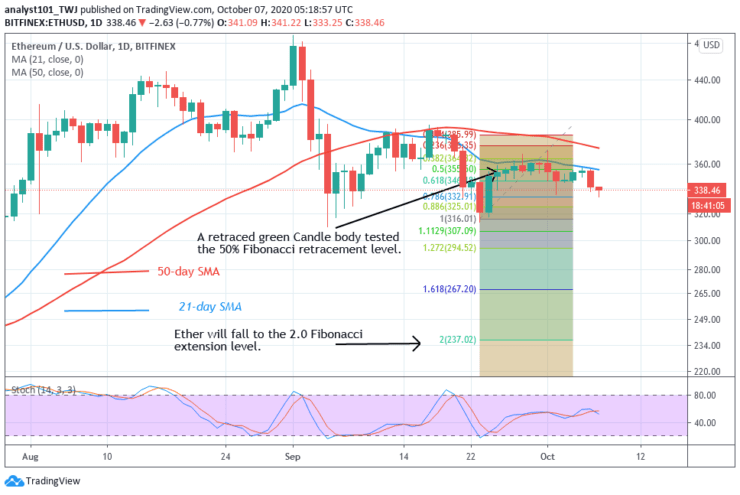
Ethereum is falling as a result of losing the $350 support level. On September 23 downtrend; the retraced candle body tested the 50% Fibonacci retracement level. This gives the impression that the coin will further decline to 2.0 Fibonacci extension level. That is a low of $237.02.
Note: Learn2.Trade is not a financial advisor. Do your research before investing your funds in any financial asset or presented product or event. We are not responsible for your investing results
- Broker
- Min Deposit
- Score
- Visit Broker

- Award-winning Cryptocurrency trading platform
- $100 minimum deposit,
- FCA & Cysec regulated

- 20% welcome bonus of upto $10,000
- Minimum deposit $100
- Verify your account before the bonus is credited
- Fund Moneta Markets account with a minimum of $250
- Opt in using the form to claim your 50% deposit bonus
Learn to Trade
Never Miss A Trade Again

Signal Notification
Real-time signal notifications whenever a signal is opened, closes or Updated

Get Alerts
Immediate alerts to your email and mobile phone.

Entry Price Levels
Entry price level for every signal Just choose one of our Top Brokers in the list above to get all this free.