Key Highlights
Ethereum rallied to $467 high but was resisted
Ether now fluctuates between $430 and $470
Ethereum (ETH) Current Statistics
The current price: $444.90
Market Capitalization: $50,429,714,060
Trading Volume: $12,712,038,773
Major supply zones: $280, $320, $360
Major demand zones: $160, $140, $100
Ethereum (ETH) Price Analysis November 8, 2020
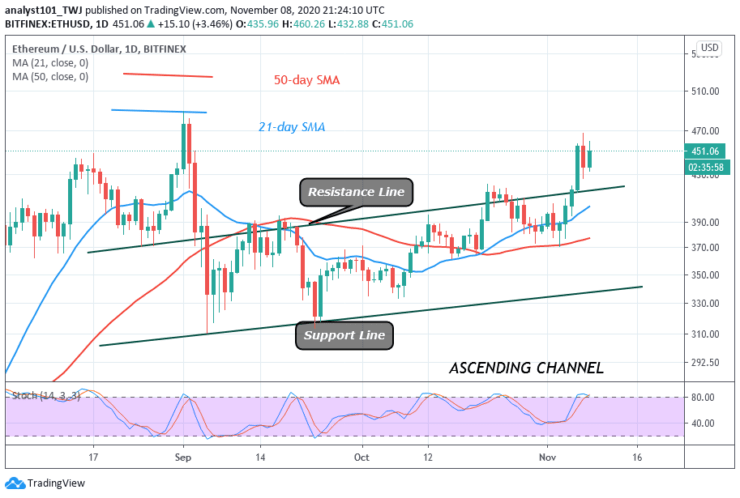
On November 7, Ether traded and reached a peak price of $467. The biggest altcoin is now in a sideways move as buyers fail to push above the $470 resistance level. The bottom line is that if the bulls sustain a price above $450, the upside momentum will resume.
Meanwhile, the crypto is fluctuating between $430 and $470. A break below $430 will invalidate the current upward move. Besides, the coin will slump to a $390 low. Conversely, if the bulls break the $470 resistance, ETH will reach a high of $488. Nevertheless, Ether is trading at $451 at the time of writing.
ETH Technical Indicators Reading
ETH is above the 80% range of the daily stochastic. It indicates that the market has reached the overbought region of the market. Sellers may emerge to push prices downward. The coin has a bullish crossover as the 21-day SMA crosses over the 50-day SMA.
Conclusion
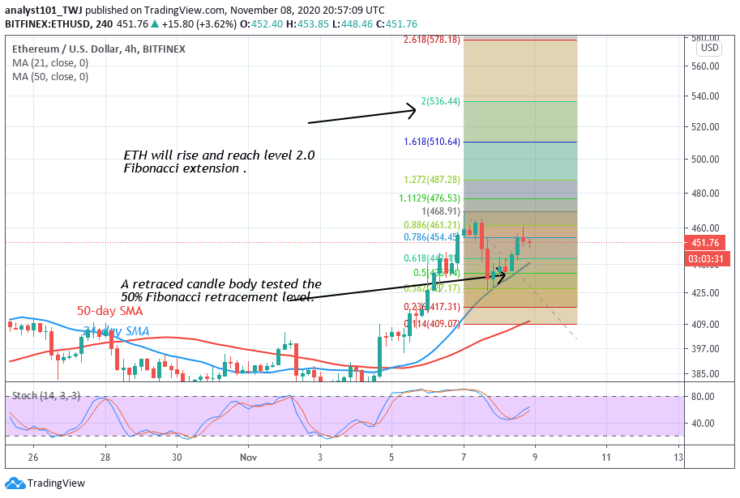
Ethereum is consolidating above $ 430 support after rejection from the recent high. On November 7 uptrend, Ether was resisted. The retraced candle body tested the 50% Fibonacci retracement level. The implication is that the coin will rise and reach level 2.0 Fibonacci extension or $536.44.
Note: Learn2.Trade is not a financial advisor. Do your research before investing your funds in any financial asset or presented product or event. We are not responsible for your investing results
- Broker
- Min Deposit
- Score
- Visit Broker

- Award-winning Cryptocurrency trading platform
- $100 minimum deposit,
- FCA & Cysec regulated

- 20% welcome bonus of upto $10,000
- Minimum deposit $100
- Verify your account before the bonus is credited
- Fund Moneta Markets account with a minimum of $250
- Opt in using the form to claim your 50% deposit bonus
Learn to Trade
Never Miss A Trade Again

Signal Notification
Real-time signal notifications whenever a signal is opened, closes or Updated

Get Alerts
Immediate alerts to your email and mobile phone.

Entry Price Levels
Entry price level for every signal Just choose one of our Top Brokers in the list above to get all this free.