Key Highlights
Ether rebounds above $376, breaks resistance at $380 and $395
Ethereum is likely to reach a high of $420
Ethereum (ETH) Current Statistics
The current price: $402.11
Market Capitalization: $45,554,549,947
Trading Volume: $14,203,450,629
Major supply zones: $280, $320, $360
Major demand zones: $160, $140, $100
Ethereum (ETH) Price Analysis November 4, 2020
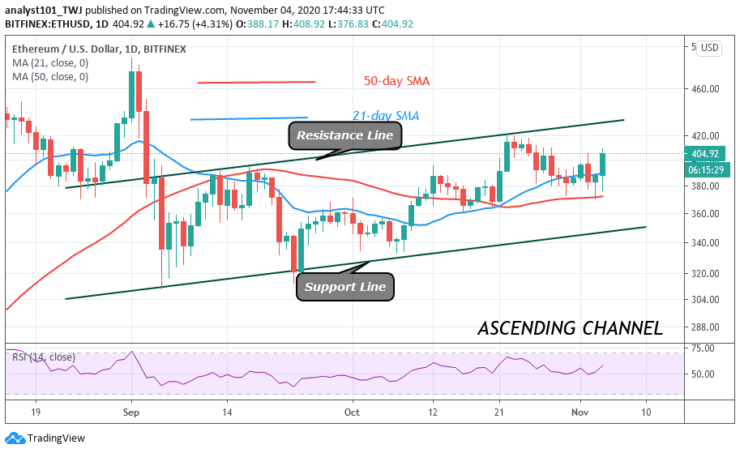
Today, Ethereum rebounded above $376 as price breaks the resistance at $380 and $395. The price surge reached a high of $408 but there was a pullback. The price is hovering above the $400 support. For the upside momentum to continue, the bulls must sustain the bullish momentum above $395. The biggest altcoin will reach a high of $420 if the momentum is sustained. Conversely, if price retraces and breaks below $395, Ether is likely to fall to $380 support. ETH is trading at $402 at the time of writing.
ETH Technical Indicators Reading
Ethereum breaks above the SMAs which suggests that the coin is likely to rise. Presently the SMAs are sloping horizontally indicating the sideways move. The coin is at level 57 of the Relative Strength index period 14.
Conclusion
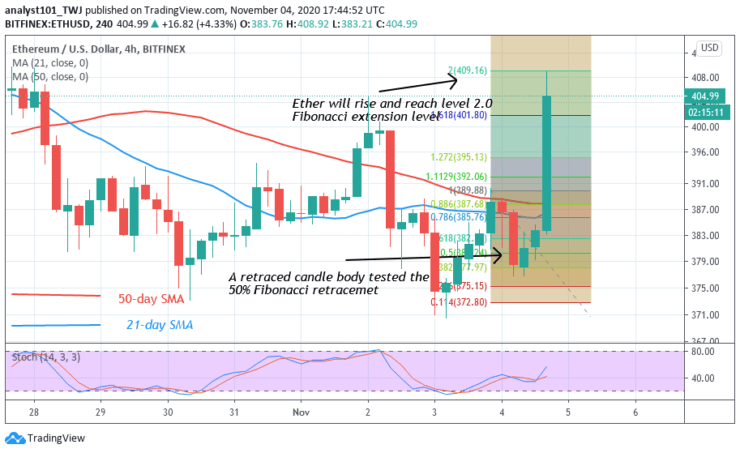
Ethereum has resumed upward move as price breaks the previous resistance. On November 3 uptrend, ETH was resisted at $390. However, the retraced candle body tested the 50% Fibonacci retracement level, This implies that the market will rise and reach a high of 2.0 Fibonacci extension or the high of $409.16.
Note: Learn2.Trade is not a financial advisor. Do your research before investing your funds in any financial asset or presented product or event. We are not responsible for your investing results
- Broker
- Min Deposit
- Score
- Visit Broker

- Award-winning Cryptocurrency trading platform
- $100 minimum deposit,
- FCA & Cysec regulated

- 20% welcome bonus of upto $10,000
- Minimum deposit $100
- Verify your account before the bonus is credited
- Fund Moneta Markets account with a minimum of $250
- Opt in using the form to claim your 50% deposit bonus
Learn to Trade
Never Miss A Trade Again

Signal Notification
Real-time signal notifications whenever a signal is opened, closes or Updated

Get Alerts
Immediate alerts to your email and mobile phone.

Entry Price Levels
Entry price level for every signal Just choose one of our Top Brokers in the list above to get all this free.