Key Highlights
ETH trend higher and breaks the current price range of $480 and $520
Ethereum bulls buy the dips on November 26 and resume upside momentum
Ethereum (ETH) Current Statistics
The current price: $567.76
Market Capitalization: $64,514,961,747
Trading Volume: $14,304,766,539
Major supply zones: $280, $320, $360
Major demand zones: $160, $140, $100
Ethereum (ETH) Price Analysis November 29, 2020
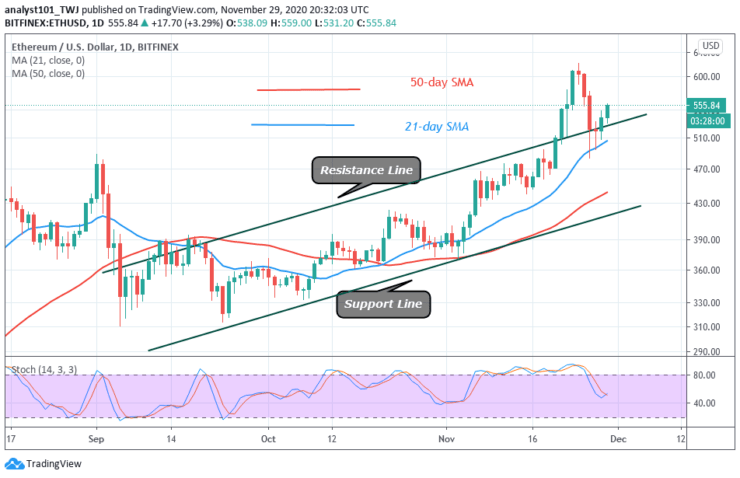
On November 26, Ether plunged to $485 as bulls buy the dips to resume upside momentum. The candlesticks on November 26 were indicating various lengths of tails. These long tails indicate that there is buying pressure at a lower price level. The biggest altcoin is trading at $556 at the time of writing. A retest at the $620 overhead resistance is possible.
ETH Technical Indicators Reading
The price has broken above the resistance line of the ascending channel. This indicates the upward movement of the coin. Ether is above the 40% range of the daily stochastic. It indicates that the coin is in a bullish momentum.
Conclusion
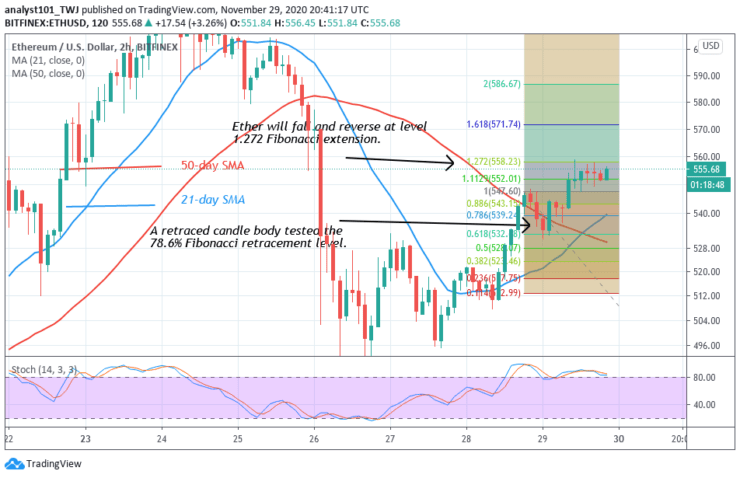
Ethereum is in an upward move as it approaches the resistance at $620. On November 28 uptrend, a retraced candle body tested the 78.6% Fibonacci retracement level. This retracement gives the impression that the uptrend will continue to rise but reverse at level 1.272 Fibonacci extensions. That is the high of $558.13. However, the price action has surpassed that level.
Note: Learn2.Trade is not a financial advisor. Do your research before investing your funds in any financial asset or presented product or event. We are not responsible for your investing results
- Broker
- Min Deposit
- Score
- Visit Broker

- Award-winning Cryptocurrency trading platform
- $100 minimum deposit,
- FCA & Cysec regulated

- 20% welcome bonus of upto $10,000
- Minimum deposit $100
- Verify your account before the bonus is credited
- Fund Moneta Markets account with a minimum of $250
- Opt in using the form to claim your 50% deposit bonus
Learn to Trade
Never Miss A Trade Again

Signal Notification
Real-time signal notifications whenever a signal is opened, closes or Updated

Get Alerts
Immediate alerts to your email and mobile phone.

Entry Price Levels
Entry price level for every signal Just choose one of our Top Brokers in the list above to get all this free.