Key Highlights
Ether consolidates between levels 375 and $394
The upward move likely
Ethereum (ETH) Current Statistics
The current price: $389.05
Market Capitalization: $44,059,391,006
Trading Volume: $8,913,925,698
Major supply zones: $280, $320, $360
Major demand zones: $160, $140, $100
Ethereum (ETH) Price Analysis November 1, 2020
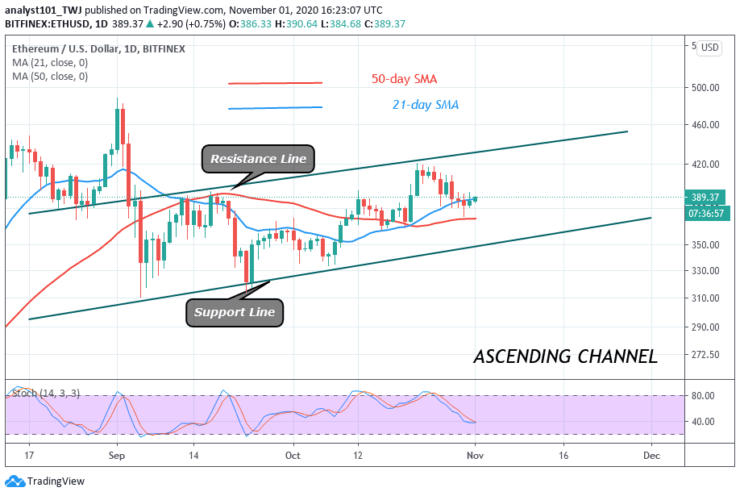
Ethereum has continued its upward move after recovering above $380 support. On October 30, the biggest altcoin fell to the low at $375 as the bulls buy the dips. The coin has moved up and retested the high of $394. Presently, the coin is fluctuating between $375 and $394.
Ether will rise as long as the bulls sustain price above $380. Alternatively, a breakout at $394 will cause the coin to rally above $420. However, if the bulls fail to break the current resistance, the sideways move between $375 and $394 will continue.
ETH Technical Indicators Reading
Ether is still trading in the middle of the ascending channel. The coin is yet to break the resistance and the support lines of the ascending channel. However, the price breaks the 21-day SMA and has recovered above it. The upward movement will continue.
Conclusion
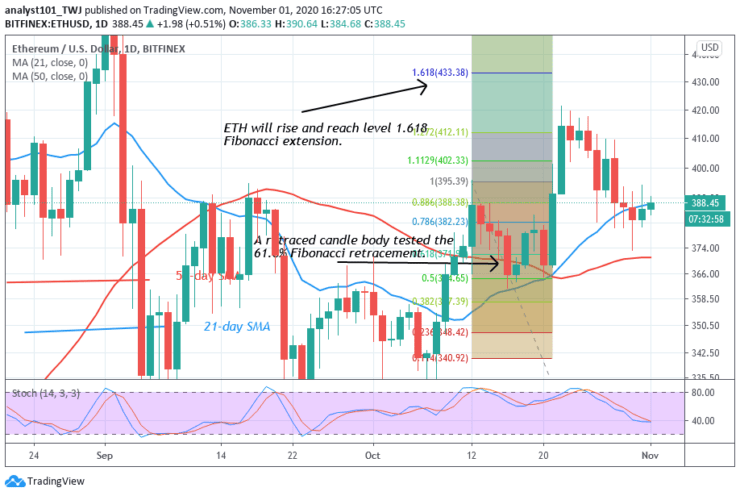
The major resistance to Ether’s upward move is the resistance at $420. According to the Fibonacci tool, Ether is likely to rise. On October 12 uptrend, the retraced candle tested the 61.8 Fibonacci retracement level. This implies that the biggest altcoin will rise and reach a level of 1.618 Fibonacci extension
Note: Learn2.Trade is not a financial advisor. Do your research before investing your funds in any financial asset or presented product or event. We are not responsible for your investing results
- Broker
- Min Deposit
- Score
- Visit Broker

- Award-winning Cryptocurrency trading platform
- $100 minimum deposit,
- FCA & Cysec regulated

- 20% welcome bonus of upto $10,000
- Minimum deposit $100
- Verify your account before the bonus is credited
- Fund Moneta Markets account with a minimum of $250
- Opt in using the form to claim your 50% deposit bonus
Learn to Trade
Never Miss A Trade Again

Signal Notification
Real-time signal notifications whenever a signal is opened, closes or Updated

Get Alerts
Immediate alerts to your email and mobile phone.

Entry Price Levels
Entry price level for every signal Just choose one of our Top Brokers in the list above to get all this free.